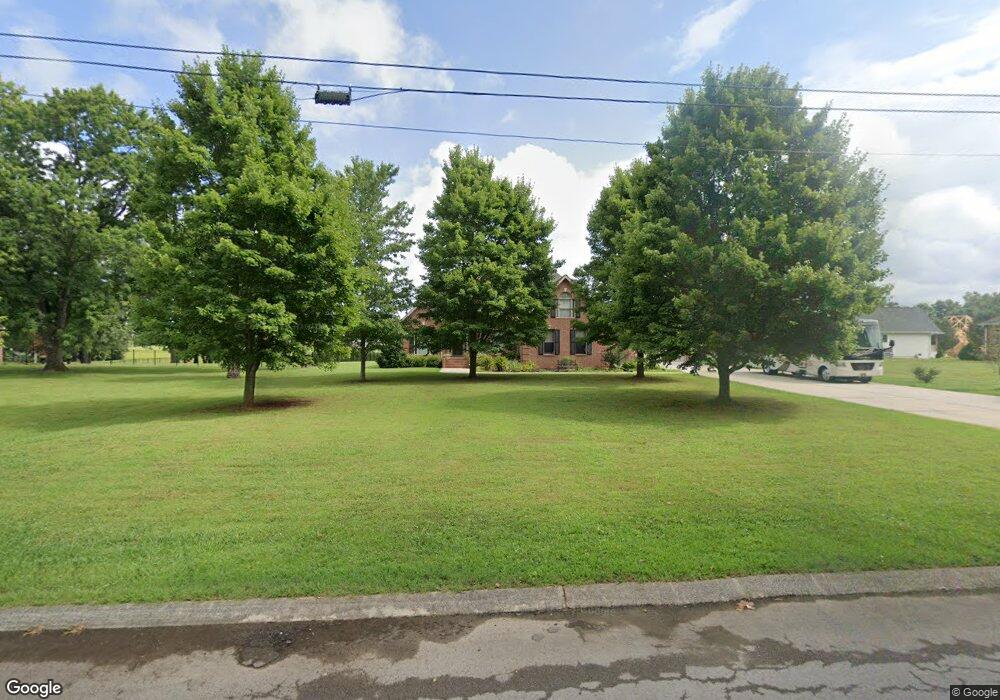
48 Kings Ridge Dr McMinnville, TN 37110
Estimated Value: $433,000 - $609,000
--
Bed
3
Baths
2,902
Sq Ft
$178/Sq Ft
Est. Value
About This Home
This home is located at 48 Kings Ridge Dr, McMinnville, TN 37110 and is currently estimated at $516,780, approximately $178 per square foot. 48 Kings Ridge Dr is a home located in Warren County with nearby schools including Hickory Creek Elementary School, Warren County Middle School, and Warren County High School.
Ownership History
Date
Name
Owned For
Owner Type
Purchase Details
Closed on
Mar 12, 2013
Sold by
Rondolet Duane
Bought by
Starkey Diane E
Current Estimated Value
Purchase Details
Closed on
May 19, 2005
Sold by
Fults Addie Lee
Bought by
Rondolet Duane
Home Financials for this Owner
Home Financials are based on the most recent Mortgage that was taken out on this home.
Original Mortgage
$195,700
Interest Rate
5.74%
Purchase Details
Closed on
Oct 2, 2003
Sold by
Perry Kent and Perry Betty
Bought by
Fults Addie
Home Financials for this Owner
Home Financials are based on the most recent Mortgage that was taken out on this home.
Original Mortgage
$215,000
Interest Rate
6.45%
Purchase Details
Closed on
Aug 14, 1998
Bought by
Kent Perry and Henderson Betty
Create a Home Valuation Report for This Property
The Home Valuation Report is an in-depth analysis detailing your home's value as well as a comparison with similar homes in the area
Home Values in the Area
Average Home Value in this Area
Purchase History
| Date | Buyer | Sale Price | Title Company |
|---|---|---|---|
| Starkey Diane E | -- | -- | |
| Rondolet Duane | $238,000 | -- | |
| Fults Addie | $238,000 | -- | |
| Kent Perry | $250,000 | -- |
Source: Public Records
Mortgage History
| Date | Status | Borrower | Loan Amount |
|---|---|---|---|
| Previous Owner | Kent Perry | $195,700 | |
| Previous Owner | Kent Perry | $215,000 |
Source: Public Records
Tax History Compared to Growth
Tax History
| Year | Tax Paid | Tax Assessment Tax Assessment Total Assessment is a certain percentage of the fair market value that is determined by local assessors to be the total taxable value of land and additions on the property. | Land | Improvement |
|---|---|---|---|---|
| 2025 | -- | $129,450 | $0 | $0 |
| 2024 | -- | $86,375 | $6,425 | $79,950 |
| 2023 | $3,514 | $86,375 | $6,425 | $79,950 |
| 2022 | $3,298 | $86,375 | $6,425 | $79,950 |
| 2021 | $3,298 | $86,375 | $6,425 | $79,950 |
| 2020 | $1,598 | $86,375 | $6,425 | $79,950 |
| 2019 | $3,001 | $69,375 | $6,750 | $62,625 |
| 2018 | $2,807 | $69,375 | $6,750 | $62,625 |
| 2017 | $2,807 | $69,375 | $6,750 | $62,625 |
| 2016 | $2,807 | $69,375 | $6,750 | $62,625 |
| 2015 | $2,828 | $69,375 | $6,750 | $62,625 |
| 2014 | $2,662 | $69,375 | $6,750 | $62,625 |
| 2013 | $2,662 | $65,156 | $0 | $0 |
Source: Public Records
Map
Nearby Homes
- 126 Wilson Ln
- 122 Myers Ln
- 166 Old Shelbyville Rd
- 317 Lakeshore Dr
- 106 June St
- 107 Bermuda Dr
- 728 W Main St
- 111 June St
- 536 Patton Rd
- 104 Hickory Ln
- 202 Oak Hill Dr
- 400 Westwood Dr
- 108 James St
- 603 Westwood Dr
- 314 Westwood Dr
- 301 Ben Lomond Dr
- 103 Sunset Dr
- 101 Hillwood Ln
- 303 Westwood Dr
- 209 Ben Lomond Dr
- 198 Wilson Ln
- 80 Kings Ridge Dr
- 176 Wilson Ln
- 187 Wilson Ln
- 17 S Steeplechase Dr
- 75 Kings Ridge Dr
- 217 Wilson Ln
- 97 Kings Ridge Dr
- 50 S Steeplechase Dr
- 117 Wilson Ln
- 125 Kings Ridge Dr
- 55 S Steeplechase Dr
- 316 Wilson Ln
- 145 Kings Ridge Dr
- 301 Wilson Ln
- 75 Wilson Ln
- 94 S Steeplechase Dr
- 53 Wilson Ln
- 37 Myers Ln
- 88 N Steeplechase Dr