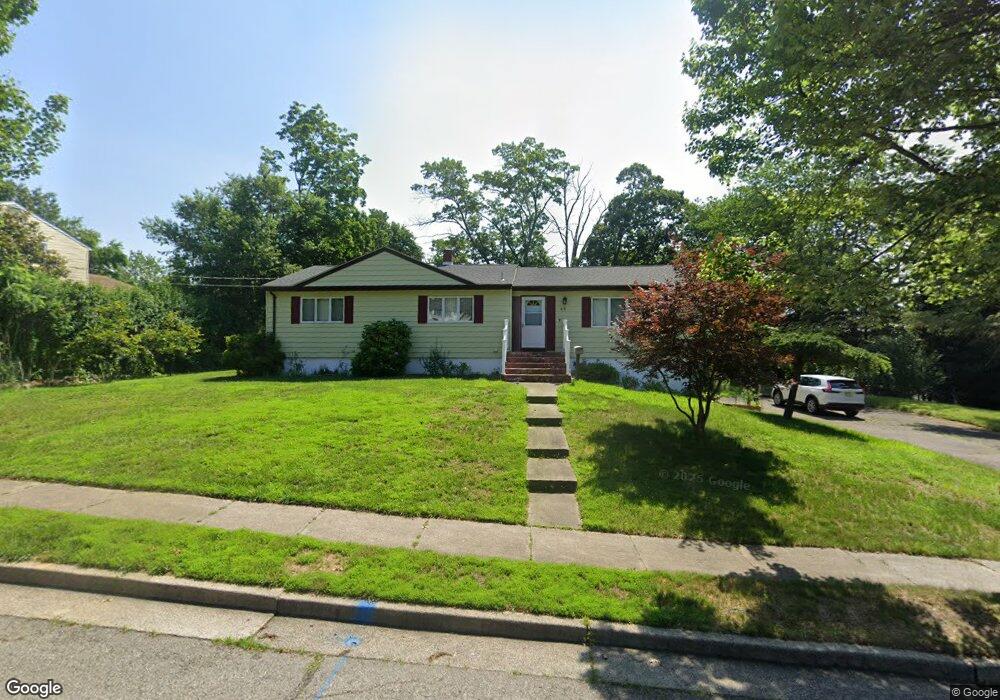
48 Landsdowne Rd East Brunswick, NJ 08816
Estimated Value: $480,252 - $740,000
--
Bed
--
Bath
1,578
Sq Ft
$418/Sq Ft
Est. Value
About This Home
This home is located at 48 Landsdowne Rd, East Brunswick, NJ 08816 and is currently estimated at $659,563, approximately $417 per square foot. 48 Landsdowne Rd is a home located in Middlesex County with nearby schools including Robert Frost Elementary School, Hammarskjold Upper Elementary School, and Churchill Junior High School.
Ownership History
Date
Name
Owned For
Owner Type
Purchase Details
Closed on
Apr 10, 2024
Sold by
Avgerinos Chris and Avgerinos Myung Sook
Bought by
Avgerinos Myung Sook and Lee Sin Hee
Current Estimated Value
Purchase Details
Closed on
Apr 14, 2008
Sold by
Kang Michael and Kang Gihyun
Bought by
Avgerinos Chris and Avgerinos Myung Sook
Home Financials for this Owner
Home Financials are based on the most recent Mortgage that was taken out on this home.
Original Mortgage
$340,000
Interest Rate
5.99%
Mortgage Type
Purchase Money Mortgage
Purchase Details
Closed on
Oct 15, 2002
Sold by
Wheat Ralph
Bought by
Kang Michael
Home Financials for this Owner
Home Financials are based on the most recent Mortgage that was taken out on this home.
Original Mortgage
$232,000
Interest Rate
6.07%
Create a Home Valuation Report for This Property
The Home Valuation Report is an in-depth analysis detailing your home's value as well as a comparison with similar homes in the area
Home Values in the Area
Average Home Value in this Area
Purchase History
| Date | Buyer | Sale Price | Title Company |
|---|---|---|---|
| Avgerinos Myung Sook | -- | None Listed On Document | |
| Avgerinos Myung Sook | -- | None Listed On Document | |
| Avgerinos Chris | $425,000 | New Jersey Land Title | |
| Kang Michael | $290,000 | -- |
Source: Public Records
Mortgage History
| Date | Status | Borrower | Loan Amount |
|---|---|---|---|
| Previous Owner | Avgerinos Chris | $340,000 | |
| Previous Owner | Kang Michael | $232,000 |
Source: Public Records
Tax History Compared to Growth
Tax History
| Year | Tax Paid | Tax Assessment Tax Assessment Total Assessment is a certain percentage of the fair market value that is determined by local assessors to be the total taxable value of land and additions on the property. | Land | Improvement |
|---|---|---|---|---|
| 2025 | $12,170 | $99,800 | $37,600 | $62,200 |
| 2024 | $11,806 | $99,800 | $37,600 | $62,200 |
| 2023 | $11,806 | $99,800 | $37,600 | $62,200 |
| 2022 | $11,759 | $99,800 | $37,600 | $62,200 |
| 2021 | $11,424 | $99,800 | $37,600 | $62,200 |
| 2020 | $11,408 | $99,800 | $37,600 | $62,200 |
| 2019 | $11,286 | $99,800 | $37,600 | $62,200 |
| 2018 | $11,095 | $99,800 | $37,600 | $62,200 |
| 2017 | $10,916 | $99,800 | $37,600 | $62,200 |
| 2016 | $10,696 | $99,800 | $37,600 | $62,200 |
| 2015 | $10,444 | $99,800 | $37,600 | $62,200 |
| 2014 | $10,219 | $99,800 | $37,600 | $62,200 |
Source: Public Records
Map
Nearby Homes
- 5 Queens Rd
- 17 Stephens Dr
- 12 Francis Rd
- 349 Summerhill Rd
- 13 Francis Rd
- 7 Lorraine Ct
- 90 van Liew Ct
- 154 Kane Ave
- 113 Lloyd Ct
- 376 New Brunswick Ave
- 12 Watchung Rd
- 257 Summerhill Rd
- 78 Madie Ave
- 89 Griggs Place
- 17 Dobson Rd
- 417 Adirondack Ave
- 78 Whitehead Ln Unit 78
- 114 Griggs Place
- 114 Griggs Place Unit FL
- 24 Lonczak Ln