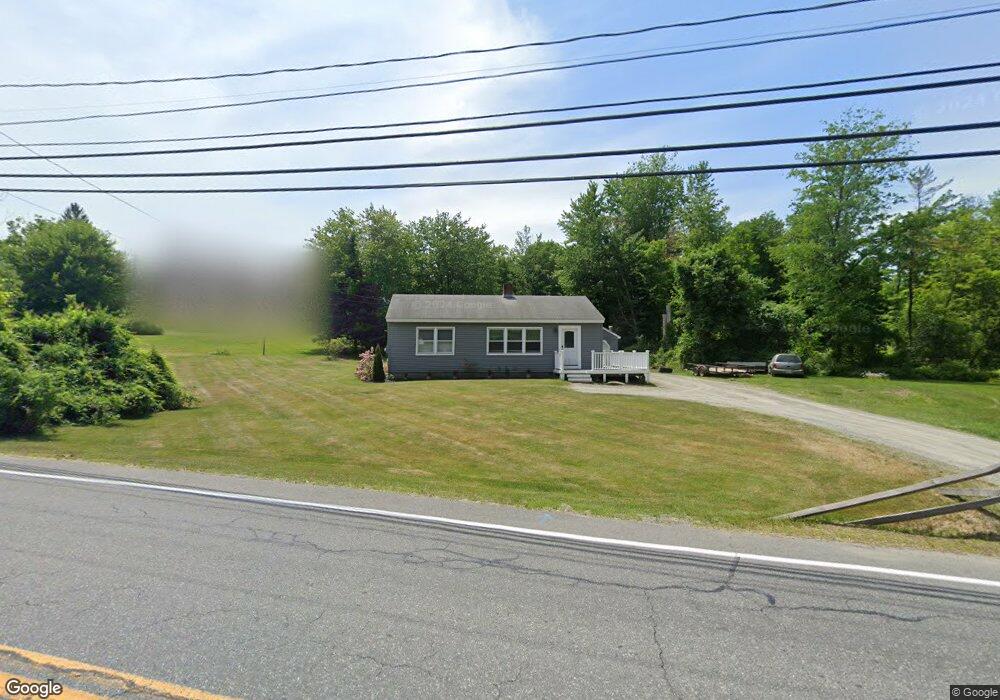
48 Maple Ave Claremont, NH 03743
South End NeighborhoodEstimated Value: $196,000 - $252,589
2
Beds
1
Bath
912
Sq Ft
$245/Sq Ft
Est. Value
About This Home
This home is located at 48 Maple Ave, Claremont, NH 03743 and is currently estimated at $223,647, approximately $245 per square foot. 48 Maple Ave is a home located in Sullivan County with nearby schools including Maple Avenue School, Claremont Middle School, and Stevens High School.
Ownership History
Date
Name
Owned For
Owner Type
Purchase Details
Closed on
Mar 7, 2025
Sold by
Scranton Christine M
Bought by
Scranton Todd R
Current Estimated Value
Home Financials for this Owner
Home Financials are based on the most recent Mortgage that was taken out on this home.
Original Mortgage
$77,000
Outstanding Balance
$76,612
Interest Rate
6.95%
Mortgage Type
Second Mortgage Made To Cover Down Payment
Estimated Equity
$147,035
Purchase Details
Closed on
Mar 17, 1999
Sold by
Leavitt Michael D
Bought by
Scranton Todd R
Home Financials for this Owner
Home Financials are based on the most recent Mortgage that was taken out on this home.
Original Mortgage
$69,427
Interest Rate
6.74%
Create a Home Valuation Report for This Property
The Home Valuation Report is an in-depth analysis detailing your home's value as well as a comparison with similar homes in the area
Home Values in the Area
Average Home Value in this Area
Purchase History
| Date | Buyer | Sale Price | Title Company |
|---|---|---|---|
| Scranton Todd R | $185,000 | None Available | |
| Scranton Todd R | $185,000 | None Available | |
| Scranton Todd R | $70,000 | -- | |
| Scranton Todd R | $70,000 | -- |
Source: Public Records
Mortgage History
| Date | Status | Borrower | Loan Amount |
|---|---|---|---|
| Open | Scranton Todd R | $77,000 | |
| Closed | Scranton Todd R | $77,000 | |
| Previous Owner | Scranton Todd R | $69,427 |
Source: Public Records
Tax History Compared to Growth
Tax History
| Year | Tax Paid | Tax Assessment Tax Assessment Total Assessment is a certain percentage of the fair market value that is determined by local assessors to be the total taxable value of land and additions on the property. | Land | Improvement |
|---|---|---|---|---|
| 2024 | $6,101 | $208,500 | $41,000 | $167,500 |
| 2023 | $5,796 | $208,500 | $41,000 | $167,500 |
| 2022 | $4,768 | $114,400 | $20,000 | $94,400 |
| 2021 | $4,688 | $114,400 | $20,000 | $94,400 |
| 2020 | $4,658 | $114,400 | $20,000 | $94,400 |
| 2019 | $4,606 | $114,400 | $20,000 | $94,400 |
| 2018 | $4,418 | $105,000 | $20,000 | $85,000 |
| 2017 | $4,479 | $105,000 | $20,000 | $85,000 |
| 2016 | $4,475 | $105,000 | $20,000 | $85,000 |
| 2015 | $4,354 | $105,000 | $20,000 | $85,000 |
| 2014 | $4,340 | $105,000 | $20,000 | $85,000 |
| 2013 | $5,097 | $140,600 | $21,600 | $119,000 |
Source: Public Records
Map
Nearby Homes
- 5 Spencer Ave
- 9 Spencer Ave
- 43 Maple Ave
- 41 Maple Ave
- 56 Maple Ave
- 49 Maple Ave
- 18 Buena Vista Rd
- 21 Charlestown Rd
- 25 Charlestown Rd
- 55 Maple Ave
- 39 Maple Ave
- 8 Lea St
- 2 Brookside Ave
- 35 Charlestown Rd
- 35 Maple Ave
- 4 Brookside Ave
- 1 Charlestown Rd
- 26 Buena Vista Rd
- 19 Buena Vista Rd
- 15 Buenavista Rd