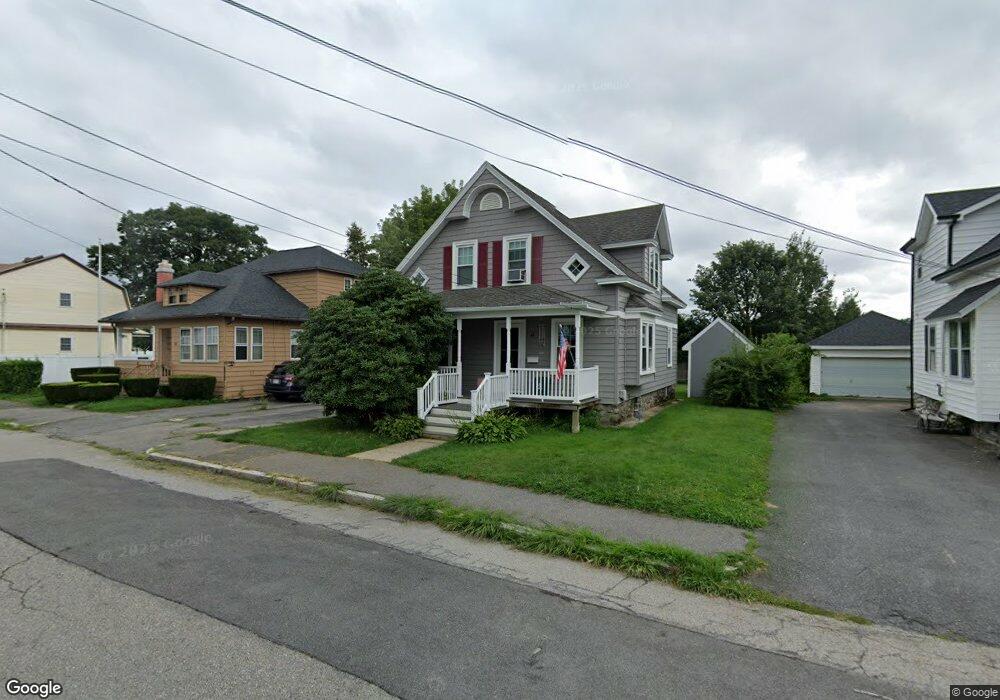
48 Marland Rd Worcester, MA 01606
Greendale NeighborhoodEstimated Value: $424,140 - $497,000
3
Beds
2
Baths
1,599
Sq Ft
$283/Sq Ft
Est. Value
About This Home
This home is located at 48 Marland Rd, Worcester, MA 01606 and is currently estimated at $453,285, approximately $283 per square foot. 48 Marland Rd is a home located in Worcester County with nearby schools including Belmont Street Community School, Jacob Hiatt Magnet School, and Chandler Magnet.
Ownership History
Date
Name
Owned For
Owner Type
Purchase Details
Closed on
Apr 28, 1995
Sold by
Bruso Betty
Bought by
Briand Cheryl
Current Estimated Value
Home Financials for this Owner
Home Financials are based on the most recent Mortgage that was taken out on this home.
Original Mortgage
$67,875
Interest Rate
8.33%
Mortgage Type
Purchase Money Mortgage
Create a Home Valuation Report for This Property
The Home Valuation Report is an in-depth analysis detailing your home's value as well as a comparison with similar homes in the area
Home Values in the Area
Average Home Value in this Area
Purchase History
| Date | Buyer | Sale Price | Title Company |
|---|---|---|---|
| Briand Cheryl | $90,500 | -- |
Source: Public Records
Mortgage History
| Date | Status | Borrower | Loan Amount |
|---|---|---|---|
| Closed | Briand Cheryl | $67,875 | |
| Previous Owner | Briand Cheryl | $10,000 | |
| Closed | Briand Cheryl | $18,100 |
Source: Public Records
Tax History Compared to Growth
Tax History
| Year | Tax Paid | Tax Assessment Tax Assessment Total Assessment is a certain percentage of the fair market value that is determined by local assessors to be the total taxable value of land and additions on the property. | Land | Improvement |
|---|---|---|---|---|
| 2025 | $4,475 | $339,300 | $103,100 | $236,200 |
| 2024 | $4,289 | $311,900 | $103,100 | $208,800 |
| 2023 | $4,117 | $287,100 | $89,600 | $197,500 |
| 2022 | $3,792 | $249,300 | $71,700 | $177,600 |
| 2021 | $3,715 | $228,200 | $57,400 | $170,800 |
| 2020 | $3,536 | $208,000 | $57,400 | $150,600 |
| 2019 | $3,397 | $188,700 | $51,600 | $137,100 |
| 2018 | $3,387 | $179,100 | $51,600 | $127,500 |
| 2017 | $3,240 | $168,600 | $51,600 | $117,000 |
| 2016 | $3,232 | $156,800 | $38,700 | $118,100 |
| 2015 | $3,147 | $156,800 | $38,700 | $118,100 |
| 2014 | $3,064 | $156,800 | $38,700 | $118,100 |
Source: Public Records
Map
Nearby Homes
- 55 Prudential Rd
- 49 Prudential Rd
- 80 Prudential Rd
- 12 Prudential Rd
- 68 Housatonic St
- 30 Danielles Way
- 29 E Mountain
- 18 Danielles Way
- 89 E Mountain St
- 43 Fales St
- 66 Mount Ave
- 37 Uncatena Ave
- 14 Fales St
- 126 Brooks St
- 40 Francis St
- 3 Malden St
- 131 Airlie St
- 14 Housatonic St
- 314 Burncoat St
- 28 Brooks St
- 50 Marland Rd
- 46 Marland Rd
- 46 Marland Rd Unit 1
- 44 Marland Rd
- 460 Burncoat St
- 460 Burncoat St Unit 460 Burncoat Street
- 460 Burncoat St Unit 460B Burncoat Street
- 460 Burncoat St
- 460 Burncoat St Unit B
- 454 Burncoat St
- 43 Marland Rd
- 3 Marland Ct
- 41 Marland Rd
- 45 Marland Rd
- 462 Burncoat St
- 39 Marland Rd
- 40 Marland Rd
- 37 Marland Rd
- 464 Burncoat St
- 7 Arden Rd