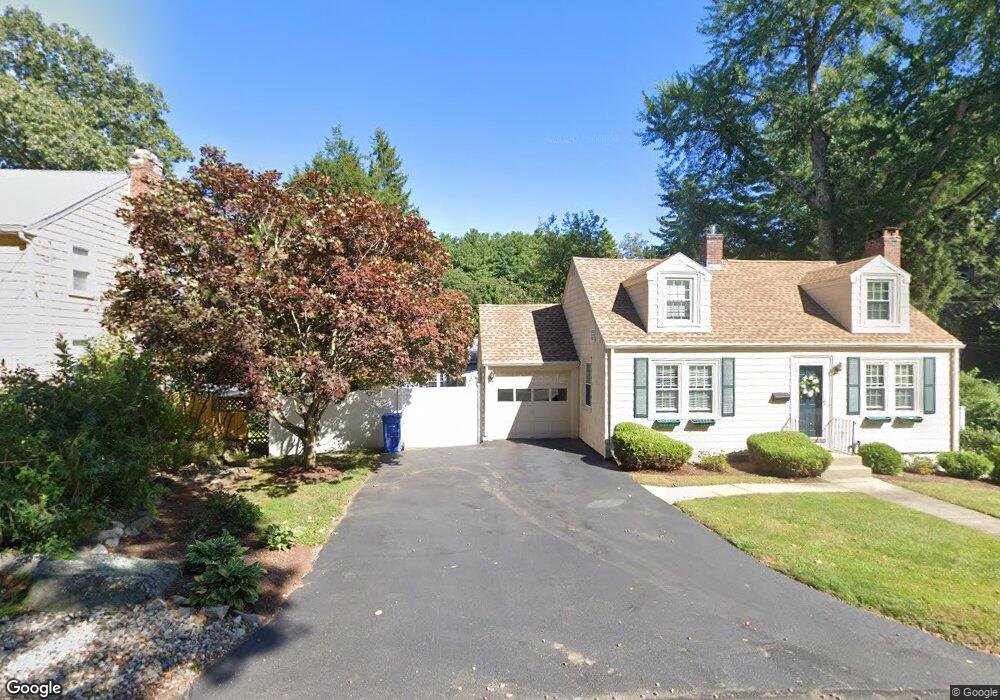
48 Meriam St Wakefield, MA 01880
Greenwood NeighborhoodEstimated Value: $744,000 - $1,011,000
3
Beds
2
Baths
2,202
Sq Ft
$372/Sq Ft
Est. Value
About This Home
This home is located at 48 Meriam St, Wakefield, MA 01880 and is currently estimated at $819,471, approximately $372 per square foot. 48 Meriam St is a home located in Middlesex County with nearby schools including Wakefield Memorial High School, St Joseph School, and St. Patrick Elementary School.
Ownership History
Date
Name
Owned For
Owner Type
Purchase Details
Closed on
Sep 10, 2009
Sold by
Sullivan Helene J
Bought by
Sullivan Tr Helene J and Desforge Gerald
Current Estimated Value
Purchase Details
Closed on
Dec 3, 2008
Sold by
Brown Gertrude A and Robert Rose M
Bought by
Sullivan Helene J
Home Financials for this Owner
Home Financials are based on the most recent Mortgage that was taken out on this home.
Original Mortgage
$234,000
Interest Rate
6.11%
Mortgage Type
Purchase Money Mortgage
Create a Home Valuation Report for This Property
The Home Valuation Report is an in-depth analysis detailing your home's value as well as a comparison with similar homes in the area
Home Values in the Area
Average Home Value in this Area
Purchase History
| Date | Buyer | Sale Price | Title Company |
|---|---|---|---|
| Sullivan Tr Helene J | -- | -- | |
| Sullivan Helene J | $292,500 | -- |
Source: Public Records
Mortgage History
| Date | Status | Borrower | Loan Amount |
|---|---|---|---|
| Previous Owner | Sullivan Helene J | $234,000 |
Source: Public Records
Tax History
| Year | Tax Paid | Tax Assessment Tax Assessment Total Assessment is a certain percentage of the fair market value that is determined by local assessors to be the total taxable value of land and additions on the property. | Land | Improvement |
|---|---|---|---|---|
| 2025 | $7,085 | $624,200 | $350,900 | $273,300 |
| 2024 | $6,539 | $581,200 | $326,500 | $254,700 |
| 2023 | $6,367 | $542,800 | $304,700 | $238,100 |
| 2022 | $5,979 | $485,300 | $272,100 | $213,200 |
| 2021 | $6,520 | $512,200 | $256,100 | $256,100 |
| 2020 | $6,132 | $480,200 | $240,100 | $240,100 |
| 2019 | $5,749 | $448,100 | $224,100 | $224,000 |
| 2018 | $5,544 | $428,100 | $214,100 | $214,000 |
| 2017 | $5,215 | $400,200 | $200,100 | $200,100 |
| 2016 | $5,157 | $382,300 | $199,700 | $182,600 |
| 2015 | $4,819 | $357,500 | $186,600 | $170,900 |
| 2014 | $4,460 | $349,000 | $182,100 | $166,900 |
Source: Public Records
Map
Nearby Homes
- 824 Main St Unit 1
- 15 Hickory Hill Rd
- 1 Sidney St
- 9 Lovis Ave
- 12 Lovis Ave
- 11 Ludlow Ave
- 81 Spring St
- 177 Oak St
- 3 Veterans Ln
- 15 Brookbridge Rd
- 104 Myrtle Ave
- 0 Everett St
- 39 Tamarock Terrace
- 38 Bennett St Unit 3D
- 55 Bartley St
- 69 Foundry St Unit 310
- 69 Foundry St Unit 416
- 252 Albion St Unit 3
- 62 Foundry St Unit 310
- 62 Foundry St Unit 312
Your Personal Tour Guide
Ask me questions while you tour the home.