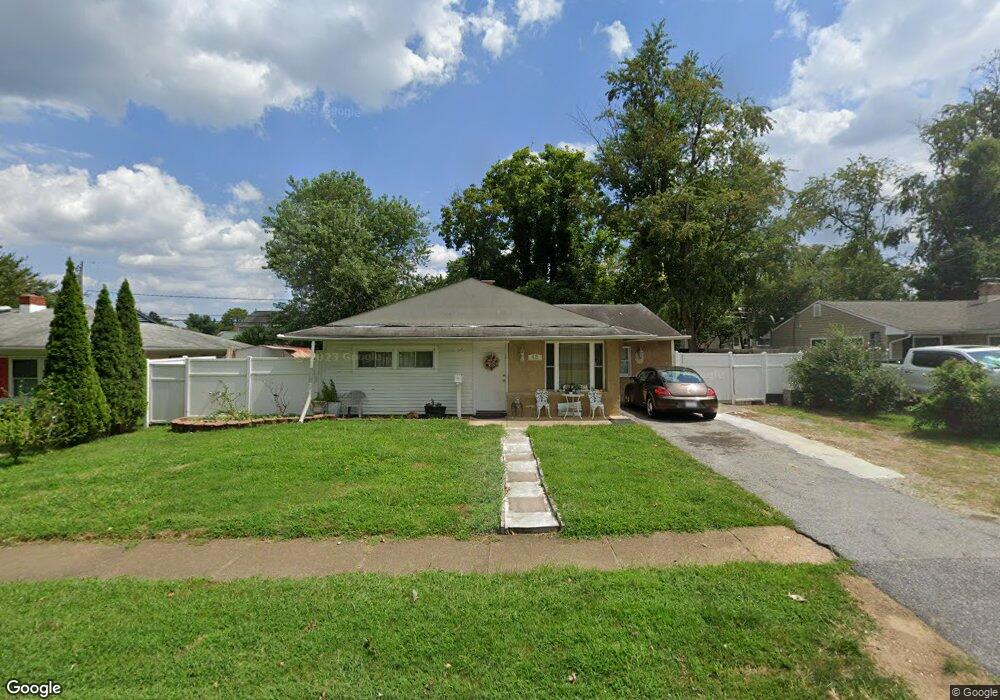
48 Montrose Dr Newark, DE 19713
Estimated Value: $250,000 - $304,104
3
Beds
1
Bath
1,310
Sq Ft
$215/Sq Ft
Est. Value
About This Home
This home is located at 48 Montrose Dr, Newark, DE 19713 and is currently estimated at $282,276, approximately $215 per square foot. 48 Montrose Dr is a home located in New Castle County with nearby schools including Brookside Elementary School, Kirk (George V.) Middle School, and Newark High School.
Ownership History
Date
Name
Owned For
Owner Type
Purchase Details
Closed on
Oct 27, 2006
Sold by
Taylor Ryan W and Taylor Ashley M
Bought by
Olivares Jose
Current Estimated Value
Home Financials for this Owner
Home Financials are based on the most recent Mortgage that was taken out on this home.
Original Mortgage
$150,000
Outstanding Balance
$90,017
Interest Rate
6.47%
Mortgage Type
Purchase Money Mortgage
Estimated Equity
$192,259
Purchase Details
Closed on
Dec 1, 2005
Sold by
Chaffin Jamie Patricia and Residual Trust Of Estate Of La
Bought by
Taylor Ryan W and Taylor Ashley M
Home Financials for this Owner
Home Financials are based on the most recent Mortgage that was taken out on this home.
Original Mortgage
$136,800
Interest Rate
6.14%
Mortgage Type
Fannie Mae Freddie Mac
Create a Home Valuation Report for This Property
The Home Valuation Report is an in-depth analysis detailing your home's value as well as a comparison with similar homes in the area
Home Values in the Area
Average Home Value in this Area
Purchase History
| Date | Buyer | Sale Price | Title Company |
|---|---|---|---|
| Olivares Jose | $187,500 | None Available | |
| Taylor Ryan W | $152,000 | -- |
Source: Public Records
Mortgage History
| Date | Status | Borrower | Loan Amount |
|---|---|---|---|
| Open | Olivares Jose | $150,000 | |
| Previous Owner | Taylor Ryan W | $136,800 |
Source: Public Records
Tax History
| Year | Tax Paid | Tax Assessment Tax Assessment Total Assessment is a certain percentage of the fair market value that is determined by local assessors to be the total taxable value of land and additions on the property. | Land | Improvement |
|---|---|---|---|---|
| 2024 | $1,806 | $42,300 | $8,500 | $33,800 |
| 2023 | $1,756 | $42,300 | $8,500 | $33,800 |
| 2022 | $1,752 | $42,300 | $8,500 | $33,800 |
| 2021 | $1,715 | $42,300 | $8,500 | $33,800 |
| 2020 | $1,671 | $42,300 | $8,500 | $33,800 |
| 2019 | $1,644 | $42,300 | $8,500 | $33,800 |
| 2018 | $1,439 | $42,300 | $8,500 | $33,800 |
| 2017 | $1,388 | $42,300 | $8,500 | $33,800 |
| 2016 | $1,384 | $42,300 | $8,500 | $33,800 |
| 2015 | $1,262 | $42,300 | $8,500 | $33,800 |
| 2014 | $1,261 | $42,300 | $8,500 | $33,800 |
Source: Public Records
Map
Nearby Homes
- 3 Merry Rd
- 6 Fleming St
- 119 Felix Dr
- 600 Judy Way
- 26 Kensington Ln
- 42 Lynch Farm Dr
- 886 Broadfield Dr
- 511 Lisbeth Rd
- 871 Broadfield Dr
- 511 Shue Dr
- 11 Kensington Ln
- 17 Pearson Dr
- 620 Ilse Dr
- 1000 Fountainview Cir Unit 311
- 1000 Fountainview Cir Unit 309
- 3000 Fountainview Cir Unit 3411
- 831 Broadfield Dr
- 619 Shue Dr
- 21 Kenmar Dr
- 47 Carole Rd
Your Personal Tour Guide
Ask me questions while you tour the home.