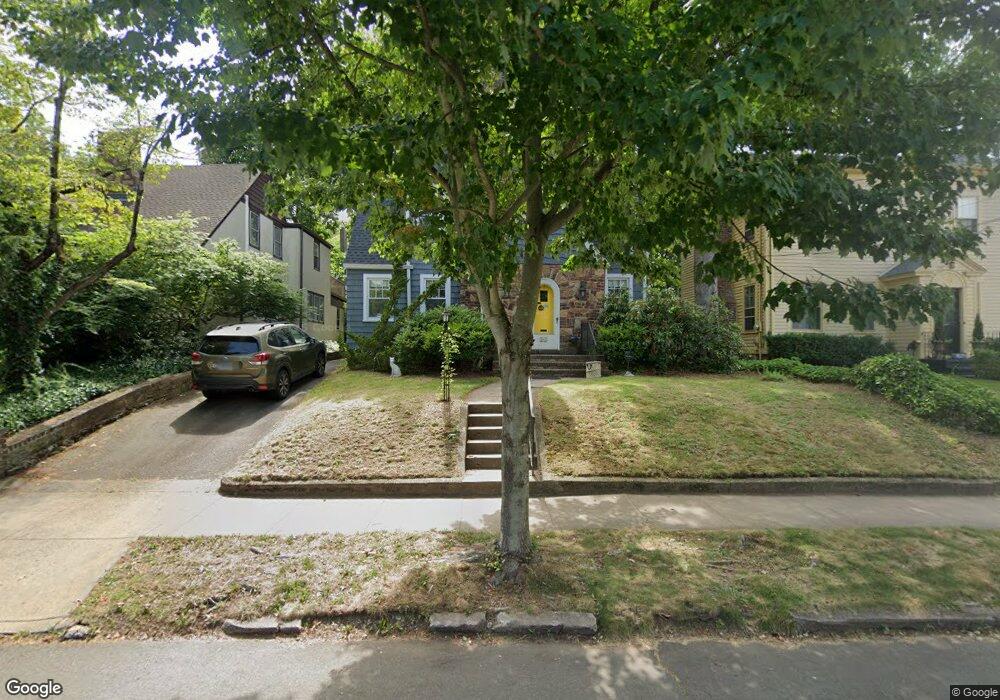
48 Morris St Hamden, CT 06517
Estimated Value: $446,000 - $705,000
4
Beds
2
Baths
1,879
Sq Ft
$276/Sq Ft
Est. Value
About This Home
This home is located at 48 Morris St, Hamden, CT 06517 and is currently estimated at $517,974, approximately $275 per square foot. 48 Morris St is a home located in New Haven County with nearby schools including Field Elementary School, Ridge Hill School, and Hamden Middle School.
Ownership History
Date
Name
Owned For
Owner Type
Purchase Details
Closed on
Apr 23, 2009
Sold by
Olmstead Todd A and Olmstead Sheila M
Bought by
Fullerton Arthur C
Current Estimated Value
Home Financials for this Owner
Home Financials are based on the most recent Mortgage that was taken out on this home.
Original Mortgage
$170,000
Outstanding Balance
$106,945
Interest Rate
4.93%
Estimated Equity
$411,029
Purchase Details
Closed on
Apr 25, 2003
Sold by
Eager Philip R
Bought by
Olmstead Todd A and Olmstead Sheila M
Home Financials for this Owner
Home Financials are based on the most recent Mortgage that was taken out on this home.
Original Mortgage
$204,800
Interest Rate
5.64%
Create a Home Valuation Report for This Property
The Home Valuation Report is an in-depth analysis detailing your home's value as well as a comparison with similar homes in the area
Home Values in the Area
Average Home Value in this Area
Purchase History
| Date | Buyer | Sale Price | Title Company |
|---|---|---|---|
| Fullerton Arthur C | $336,250 | -- | |
| Olmstead Todd A | $256,000 | -- |
Source: Public Records
Mortgage History
| Date | Status | Borrower | Loan Amount |
|---|---|---|---|
| Open | Olmstead Todd A | $170,000 | |
| Previous Owner | Olmstead Todd A | $204,800 |
Source: Public Records
Tax History Compared to Growth
Tax History
| Year | Tax Paid | Tax Assessment Tax Assessment Total Assessment is a certain percentage of the fair market value that is determined by local assessors to be the total taxable value of land and additions on the property. | Land | Improvement |
|---|---|---|---|---|
| 2025 | $14,396 | $277,480 | $83,860 | $193,620 |
| 2024 | $10,187 | $183,190 | $53,410 | $129,780 |
| 2023 | $10,328 | $183,190 | $53,410 | $129,780 |
| 2022 | $10,163 | $183,190 | $53,410 | $129,780 |
| 2021 | $9,606 | $183,190 | $53,410 | $129,780 |
| 2020 | $10,330 | $198,730 | $93,940 | $104,790 |
| 2019 | $9,710 | $198,730 | $93,940 | $104,790 |
| 2018 | $9,531 | $198,730 | $93,940 | $104,790 |
| 2017 | $8,995 | $198,730 | $93,940 | $104,790 |
| 2016 | $9,014 | $198,730 | $93,940 | $104,790 |
| 2015 | $9,490 | $232,190 | $120,890 | $111,300 |
| 2014 | $9,271 | $232,190 | $120,890 | $111,300 |
Source: Public Records
Map
Nearby Homes
- 90 Heloise St
- 133 Blake Rd
- 64 Blake Rd
- 19 Armory St
- 305 Mill Rock Rd Unit 305
- 32 Barraclough Ave
- 855 Prospect St
- 6 Prospect Ct
- 634 Newhall St
- 33 Mather St
- 43 Mulberry Hill
- 175 Treadwell St
- 210 Treadwell St Unit 601
- 210 Treadwell St Unit 405
- 2022 Whitney Ave
- 1412 Whitney Ave Unit F3
- 1412 Whitney Ave Unit J1
- 39 Lander St
- 406 Newhall St
- 1414 Whitney Ave Unit E2