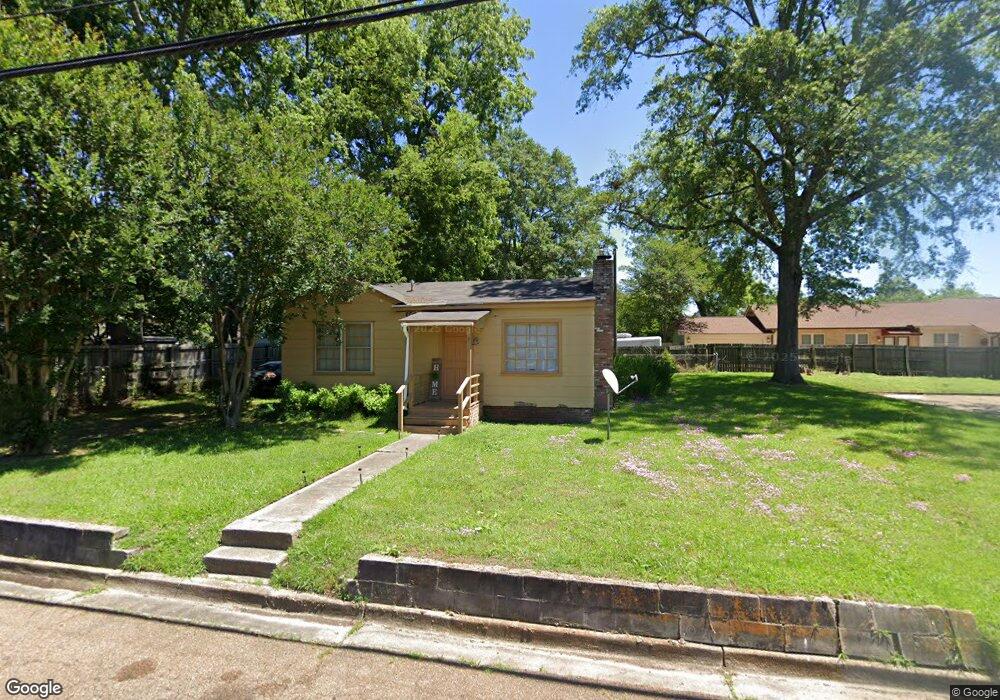
48 Mulberry St West Point, MS 39773
Estimated Value: $69,982 - $98,000
3
Beds
--
Bath
965
Sq Ft
$83/Sq Ft
Est. Value
About This Home
This home is located at 48 Mulberry St, West Point, MS 39773 and is currently estimated at $79,996, approximately $82 per square foot. 48 Mulberry St is a home with nearby schools including East Side Elementary School, West Clay Elementary School, and Church Hill Elementary School.
Ownership History
Date
Name
Owned For
Owner Type
Purchase Details
Closed on
Jun 30, 2025
Sold by
Landmark Enterprises
Bought by
Chrome Properties Llc
Current Estimated Value
Home Financials for this Owner
Home Financials are based on the most recent Mortgage that was taken out on this home.
Original Mortgage
$3,661,000
Outstanding Balance
$3,085,079
Interest Rate
6.86%
Mortgage Type
Seller Take Back
Estimated Equity
-$3,005,083
Create a Home Valuation Report for This Property
The Home Valuation Report is an in-depth analysis detailing your home's value as well as a comparison with similar homes in the area
Home Values in the Area
Average Home Value in this Area
Purchase History
| Date | Buyer | Sale Price | Title Company |
|---|---|---|---|
| Chrome Properties Llc | -- | None Listed On Document | |
| Chrome Properties Llc | -- | None Listed On Document |
Source: Public Records
Mortgage History
| Date | Status | Borrower | Loan Amount |
|---|---|---|---|
| Open | Chrome Properties Llc | $3,661,000 |
Source: Public Records
Tax History Compared to Growth
Tax History
| Year | Tax Paid | Tax Assessment Tax Assessment Total Assessment is a certain percentage of the fair market value that is determined by local assessors to be the total taxable value of land and additions on the property. | Land | Improvement |
|---|---|---|---|---|
| 2024 | $394 | $7,257 | $1,560 | $5,697 |
| 2023 | $976 | $6,524 | $1,560 | $4,964 |
| 2022 | $356 | $6,524 | $1,560 | $4,964 |
| 2021 | $353 | $6,524 | $1,560 | $4,964 |
| 2020 | $355 | $6,524 | $1,560 | $4,964 |
| 2019 | $333 | $6,478 | $1,560 | $4,918 |
| 2018 | $321 | $6,478 | $1,560 | $4,918 |
| 2017 | $321 | $6,478 | $1,560 | $4,918 |
| 2016 | $314 | $6,478 | $1,560 | $4,918 |
| 2015 | $292 | $5,903 | $1,560 | $4,343 |
| 2014 | $269 | $5,903 | $1,560 | $4,343 |
| 2013 | $269 | $5,903 | $1,560 | $4,343 |
Source: Public Records
Map
Nearby Homes
- 26788 E Main St
- 26852 E Main St
- 184 Tournament St
- 479 E Westbrook St
- 480 E Westbrook St
- 485 E Westbrook St
- 1104 E Broad St
- 98 Court St
- 238 Calhoun St
- 1153 E Broad St
- 551 E Westbrook St
- 26596 E Main St
- 1180 E Broad St
- 27045 E Main St
- 228 S Division St
- 500 Grove St
- 206 S Division St
- 63 Clay St
- 229 S Division St
- 402 Cromwell St
- 604 E Jordan Ave
- 613 E Broad St
- 607 E Jordan Ave
- 616 E Jordan Ave
- 623 E Jordan Ave
- 536 E Jordan Ave
- 472 E Jordan Ave
- 629 E Jordan Ave
- 623 E Broad St
- 535 E Jordan Ave
- 524 E Jordan Ave
- 513 E Jordan Ave
- 622 E Jordan Ave
- 603 E Jordan Ave
- 610 E Jordan Ave
- 654 E Broad St
- 520 E Jordan Ave
- 218 East St
- 211 Calhoun St
- 203 Calhoun St