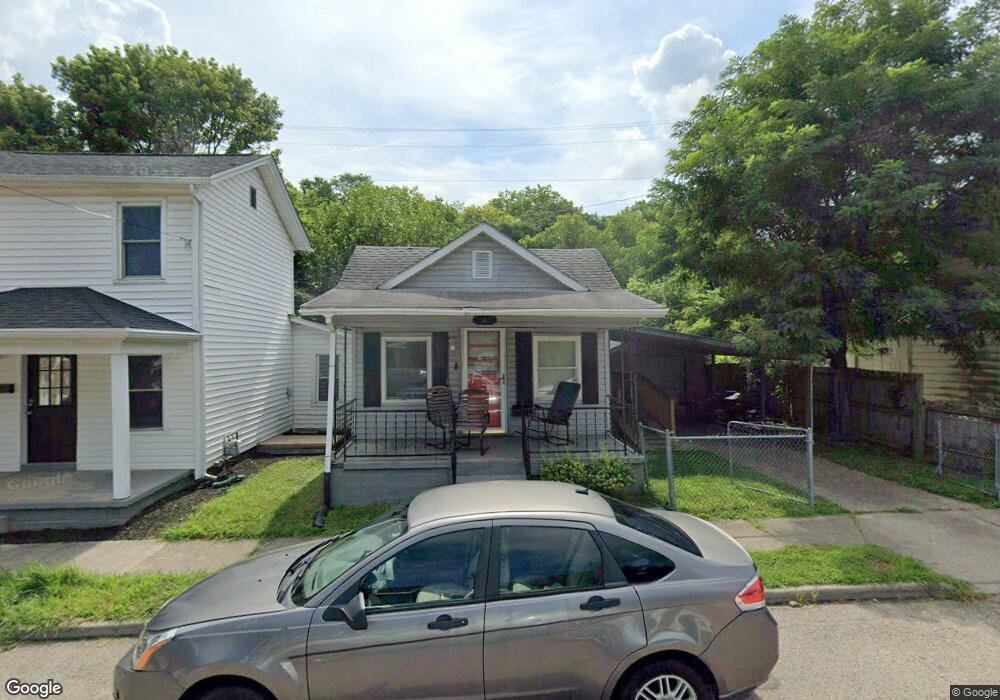
48 N Main St Franklin, OH 45005
Estimated Value: $95,000 - $121,000
2
Beds
1
Bath
904
Sq Ft
$121/Sq Ft
Est. Value
About This Home
This home is located at 48 N Main St, Franklin, OH 45005 and is currently estimated at $109,363, approximately $120 per square foot. 48 N Main St is a home located in Warren County with nearby schools including Franklin High School.
Ownership History
Date
Name
Owned For
Owner Type
Purchase Details
Closed on
Dec 12, 2017
Sold by
Freedom Real Estate
Bought by
Rfmconsulting Llc
Current Estimated Value
Home Financials for this Owner
Home Financials are based on the most recent Mortgage that was taken out on this home.
Interest Rate
3.94%
Purchase Details
Closed on
Jun 19, 2001
Sold by
Lamb Leroy A
Bought by
Lamb Leroy Terri L
Home Financials for this Owner
Home Financials are based on the most recent Mortgage that was taken out on this home.
Original Mortgage
$34,200
Interest Rate
7.16%
Mortgage Type
New Conventional
Purchase Details
Closed on
Nov 9, 1993
Sold by
Dalton Rick A and Dalton Kathy A
Bought by
Dalton and Dalton Rick A
Purchase Details
Closed on
Nov 1, 1988
Sold by
Calvin Asset Management C
Bought by
Dalton Dalton and Dalton Rick A
Purchase Details
Closed on
Jan 11, 1988
Sold by
Miracle Miracle and Miracle Sol
Bought by
Calvin Asset Management C
Purchase Details
Closed on
Sep 12, 1986
Sold by
Miracle Miracle and Miracle Sol
Bought by
Miracle Miracle and Miracle Sol
Purchase Details
Closed on
Mar 13, 1980
Sold by
Miller Miller and Miller Andrew G
Purchase Details
Closed on
Feb 8, 1980
Sold by
Wright Wright and Wright Susan D
Create a Home Valuation Report for This Property
The Home Valuation Report is an in-depth analysis detailing your home's value as well as a comparison with similar homes in the area
Home Values in the Area
Average Home Value in this Area
Purchase History
We collect this data history from publicly available records. To have your information removed, we recommend requesting removal directly through your county’s website.
| Date | Buyer | Sale Price | Title Company |
|---|---|---|---|
| Rfmconsulting Llc | $68,900 | -- | |
| Lamb Leroy Terri L | $38,000 | -- | |
| Dalton | -- | -- | |
| Dalton Dalton | $19,000 | -- | |
| Calvin Asset Management C | -- | -- | |
| Miracle Miracle | -- | -- | |
| -- | $32,900 | -- | |
| -- | $18,000 | -- |
Source: Public Records
Mortgage History
We collect this data history from publicly available records. To have your information removed, we recommend requesting removal directly through your county’s website.
| Date | Status | Borrower | Loan Amount |
|---|---|---|---|
| Closed | Rfmconsulting Llc | -- | |
| Previous Owner | Lamb Leroy Terri L | $34,200 |
Source: Public Records
Tax History
| Year | Tax Paid | Tax Assessment Tax Assessment Total Assessment is a certain percentage of the fair market value that is determined by local assessors to be the total taxable value of land and additions on the property. | Land | Improvement |
|---|---|---|---|---|
| 2025 | $1,218 | $25,300 | $2,790 | $22,510 |
| 2024 | $1,218 | $25,300 | $2,790 | $22,510 |
| 2023 | $1,080 | $20,142 | $1,585 | $19,309 |
| 2022 | $1,060 | $20,143 | $1,586 | $18,557 |
| 2021 | $1,004 | $20,143 | $1,586 | $18,557 |
| 2020 | $903 | $15,981 | $1,257 | $14,725 |
| 2019 | $823 | $15,981 | $1,257 | $14,725 |
| 2018 | $824 | $15,981 | $1,257 | $14,725 |
| 2017 | $729 | $12,940 | $1,208 | $11,732 |
| 2016 | $744 | $12,940 | $1,208 | $11,732 |
| 2015 | $744 | $12,940 | $1,208 | $11,732 |
| 2014 | $763 | $12,940 | $1,210 | $11,730 |
| 2013 | $650 | $14,970 | $1,400 | $13,570 |
Source: Public Records
Map
Nearby Homes
- 110 S River St
- 202 E 2nd St
- 0 Victoria Dr Unit 942075
- 0 Victoria Dr Unit 1852824
- 6 Maple St
- 414 Lake Ave
- 213 South Ave
- 0 E 4th St
- 410 Park Ave
- 551 E 2nd St
- 533 Spring Ave
- 121 E 5th St
- 509 Forest Ave
- 511 Forest Ave
- 99 Arlington Ave
- 614 S River St
- 441 Sunnybrook Dr
- 632 S River St
- 155 Arlington Ave
- 1200 Riley Blvd
Your Personal Tour Guide
Ask me questions while you tour the home.