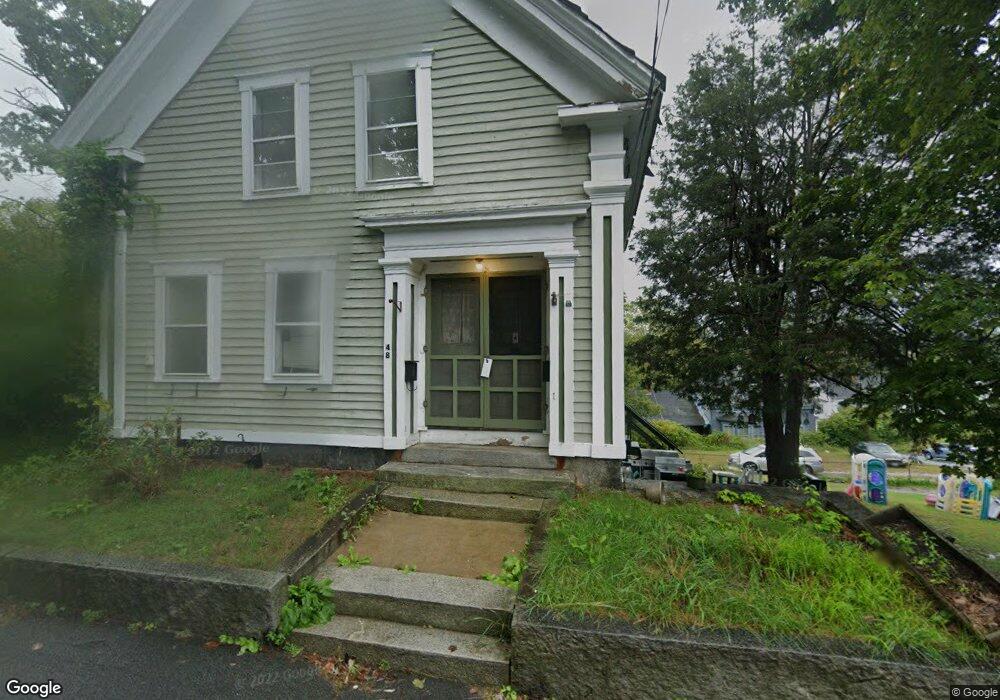
48 N Main St Orange, MA 01364
Estimated Value: $174,000 - $344,000
8
Beds
3
Baths
1,902
Sq Ft
$137/Sq Ft
Est. Value
About This Home
This home is located at 48 N Main St, Orange, MA 01364 and is currently estimated at $260,366, approximately $136 per square foot. 48 N Main St is a home located in Franklin County with nearby schools including Fisher Hill and Ralph C Mahar Regional School.
Ownership History
Date
Name
Owned For
Owner Type
Purchase Details
Closed on
Jun 2, 2006
Sold by
Theriault Donald A
Bought by
Theriault Colleen C and Theriault Donald A
Current Estimated Value
Purchase Details
Closed on
Aug 31, 1995
Sold by
Smith Albert E
Bought by
Theriault Donald F
Home Financials for this Owner
Home Financials are based on the most recent Mortgage that was taken out on this home.
Original Mortgage
$27,000
Interest Rate
7.61%
Mortgage Type
Purchase Money Mortgage
Purchase Details
Closed on
Feb 24, 1988
Sold by
Crumb Lynnwood A
Bought by
Smith Albert E
Create a Home Valuation Report for This Property
The Home Valuation Report is an in-depth analysis detailing your home's value as well as a comparison with similar homes in the area
Home Values in the Area
Average Home Value in this Area
Purchase History
| Date | Buyer | Sale Price | Title Company |
|---|---|---|---|
| Theriault Colleen C | -- | -- | |
| Theriault Donald F | $30,000 | -- | |
| Smith Albert E | $75,000 | -- |
Source: Public Records
Mortgage History
| Date | Status | Borrower | Loan Amount |
|---|---|---|---|
| Previous Owner | Smith Albert E | $27,000 |
Source: Public Records
Tax History
| Year | Tax Paid | Tax Assessment Tax Assessment Total Assessment is a certain percentage of the fair market value that is determined by local assessors to be the total taxable value of land and additions on the property. | Land | Improvement |
|---|---|---|---|---|
| 2025 | $30 | $184,900 | $25,000 | $159,900 |
| 2024 | $2,837 | $162,700 | $25,000 | $137,700 |
| 2023 | $2,809 | $156,400 | $22,500 | $133,900 |
| 2022 | $2,612 | $136,600 | $22,500 | $114,100 |
| 2021 | $2,540 | $126,700 | $41,200 | $85,500 |
| 2020 | $2,177 | $107,100 | $37,600 | $69,500 |
| 2019 | $2,119 | $94,100 | $32,600 | $61,500 |
| 2018 | $2,104 | $95,900 | $30,400 | $65,500 |
| 2017 | $2,036 | $95,900 | $30,400 | $65,500 |
| 2016 | $1,840 | $84,800 | $27,100 | $57,700 |
| 2015 | $1,682 | $81,000 | $28,900 | $52,100 |
| 2014 | $1,899 | $96,200 | $28,900 | $67,300 |
Source: Public Records
Map
Nearby Homes
- 36 Summit St Unit A
- 36 Summit St Unit B
- 12-14 E Main St
- 50 E Main St
- 58 E Main St
- 83 W Main St
- 35 Ball St
- 30 Cottage St
- 23 E Howe St
- 166-168 W Main St
- 56 Shelter St
- 39 Terrace St
- 222 W River St
- 270 S Main St
- 313-315 Walnut Hill Rd
- 549 E Main St
- 490 S Main St
- 216 Holtshire Rd
- 00 S Main St
- 000 S Main St
Your Personal Tour Guide
Ask me questions while you tour the home.