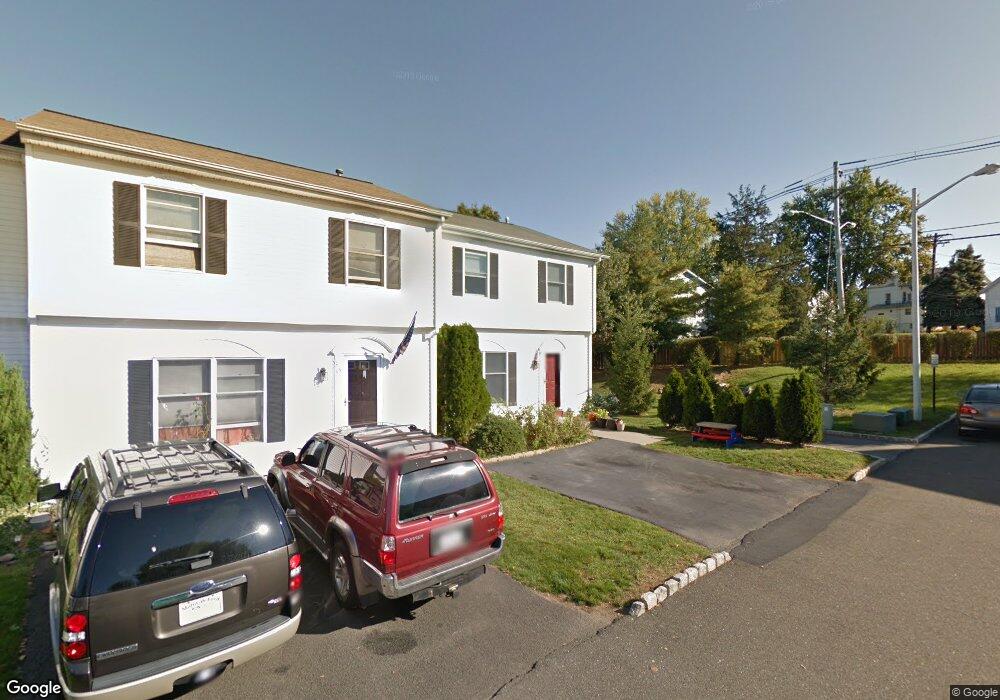
48 Ossman Ct Garnerville, NY 10923
Estimated Value: $412,267 - $476,000
3
Beds
3
Baths
1,350
Sq Ft
$329/Sq Ft
Est. Value
About This Home
This home is located at 48 Ossman Ct, Garnerville, NY 10923 and is currently estimated at $444,817, approximately $329 per square foot. 48 Ossman Ct is a home located in Rockland County with nearby schools including Thiells Elementary School, Willow Grove Middle School, and Fieldstone Secondary School.
Ownership History
Date
Name
Owned For
Owner Type
Purchase Details
Closed on
Apr 30, 2002
Sold by
Cammon Homer
Bought by
Ammer Matthew and Green Rachel
Current Estimated Value
Home Financials for this Owner
Home Financials are based on the most recent Mortgage that was taken out on this home.
Original Mortgage
$202,500
Interest Rate
6.8%
Purchase Details
Closed on
Jul 31, 2000
Sold by
Almeida Brunilda and Almeida Joaquim
Bought by
Cammon Homer
Home Financials for this Owner
Home Financials are based on the most recent Mortgage that was taken out on this home.
Original Mortgage
$152,000
Interest Rate
8.18%
Create a Home Valuation Report for This Property
The Home Valuation Report is an in-depth analysis detailing your home's value as well as a comparison with similar homes in the area
Home Values in the Area
Average Home Value in this Area
Purchase History
| Date | Buyer | Sale Price | Title Company |
|---|---|---|---|
| Ammer Matthew | $225,000 | Fidelity National Title Ins | |
| Cammon Homer | $168,900 | -- |
Source: Public Records
Mortgage History
| Date | Status | Borrower | Loan Amount |
|---|---|---|---|
| Previous Owner | Ammer Matthew | $202,500 | |
| Previous Owner | Cammon Homer | $152,000 |
Source: Public Records
Tax History
| Year | Tax Paid | Tax Assessment Tax Assessment Total Assessment is a certain percentage of the fair market value that is determined by local assessors to be the total taxable value of land and additions on the property. | Land | Improvement |
|---|---|---|---|---|
| 2022 | $1,816 | $228,500 | $66,800 | $161,700 |
| 2021 | $15,874 | $228,500 | $66,800 | $161,700 |
| 2020 | $10,326 | $228,500 | $66,800 | $161,700 |
| 2019 | $2,335 | $228,500 | $66,800 | $161,700 |
| 2018 | $10,007 | $228,500 | $66,800 | $161,700 |
| 2017 | $9,361 | $228,500 | $66,800 | $161,700 |
| 2016 | $9,372 | $228,500 | $66,800 | $161,700 |
| 2015 | -- | $228,500 | $66,800 | $161,700 |
| 2014 | -- | $228,500 | $66,800 | $161,700 |
Source: Public Records
Map
Nearby Homes
- 3 Trimble St
- 47 Sand St
- 21 Bridge St
- 78 Church St
- 14 Malone Ave
- 20 Main St Unit 39
- 20 Main St Unit 20
- 32 Brownsell Ave
- 41 Hurd Ave
- 33 Muntz Ln
- 93 Main St
- 80 Kennedy Dr
- 21 Capt Shankey Dr
- 22 Jones Dr
- 9 Oldfield Ct
- 20 Madison Ave
- 167 Coolidge St
- 22 Ferracane Place
- 4 E Railroad Ave
- 100 Dowd St Unit C16
Your Personal Tour Guide
Ask me questions while you tour the home.