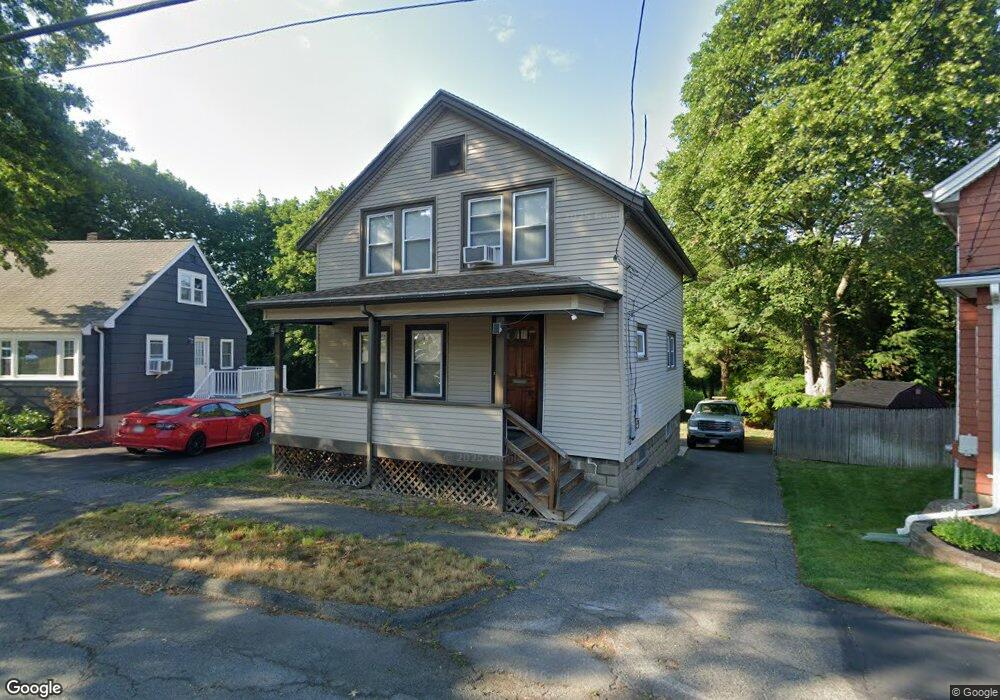
48 Pearson St Saugus, MA 01906
Downtown Saugus NeighborhoodEstimated Value: $614,462 - $667,000
3
Beds
3
Baths
1,277
Sq Ft
$500/Sq Ft
Est. Value
About This Home
This home is located at 48 Pearson St, Saugus, MA 01906 and is currently estimated at $637,866, approximately $499 per square foot. 48 Pearson St is a home located in Essex County with nearby schools including Saugus High School, Pioneer Charter School Of Science II, and Sacred Heart School.
Ownership History
Date
Name
Owned For
Owner Type
Purchase Details
Closed on
Apr 19, 2017
Sold by
Guarino Jeanette M
Bought by
Guarino Jeanette M and Guarino David E
Current Estimated Value
Purchase Details
Closed on
Apr 23, 1976
Bought by
Guarino Laurence E and Guarino Jeannette M
Create a Home Valuation Report for This Property
The Home Valuation Report is an in-depth analysis detailing your home's value as well as a comparison with similar homes in the area
Home Values in the Area
Average Home Value in this Area
Purchase History
| Date | Buyer | Sale Price | Title Company |
|---|---|---|---|
| Guarino Jeanette M | -- | -- | |
| Guarino Laurence E | -- | -- |
Source: Public Records
Mortgage History
| Date | Status | Borrower | Loan Amount |
|---|---|---|---|
| Previous Owner | Guarino Laurence E | $90,000 | |
| Previous Owner | Guarino Laurence E | $90,000 | |
| Previous Owner | Guarino Laurence E | $45,000 |
Source: Public Records
Tax History
| Year | Tax Paid | Tax Assessment Tax Assessment Total Assessment is a certain percentage of the fair market value that is determined by local assessors to be the total taxable value of land and additions on the property. | Land | Improvement |
|---|---|---|---|---|
| 2025 | $5,771 | $540,400 | $312,600 | $227,800 |
| 2024 | $5,613 | $527,000 | $304,200 | $222,800 |
| 2023 | $5,430 | $482,200 | $266,100 | $216,100 |
| 2022 | $5,251 | $437,200 | $247,600 | $189,600 |
| 2021 | $4,711 | $381,800 | $205,300 | $176,500 |
| 2020 | $4,347 | $364,700 | $195,200 | $169,500 |
| 2019 | $4,329 | $355,400 | $185,900 | $169,500 |
| 2018 | $3,915 | $338,100 | $177,400 | $160,700 |
| 2017 | $3,709 | $307,800 | $169,000 | $138,800 |
| 2016 | $3,137 | $257,100 | $159,400 | $97,700 |
| 2015 | $2,944 | $244,900 | $151,900 | $93,000 |
| 2014 | $2,973 | $256,100 | $151,900 | $104,200 |
Source: Public Records
Map
Nearby Homes
Your Personal Tour Guide
Ask me questions while you tour the home.