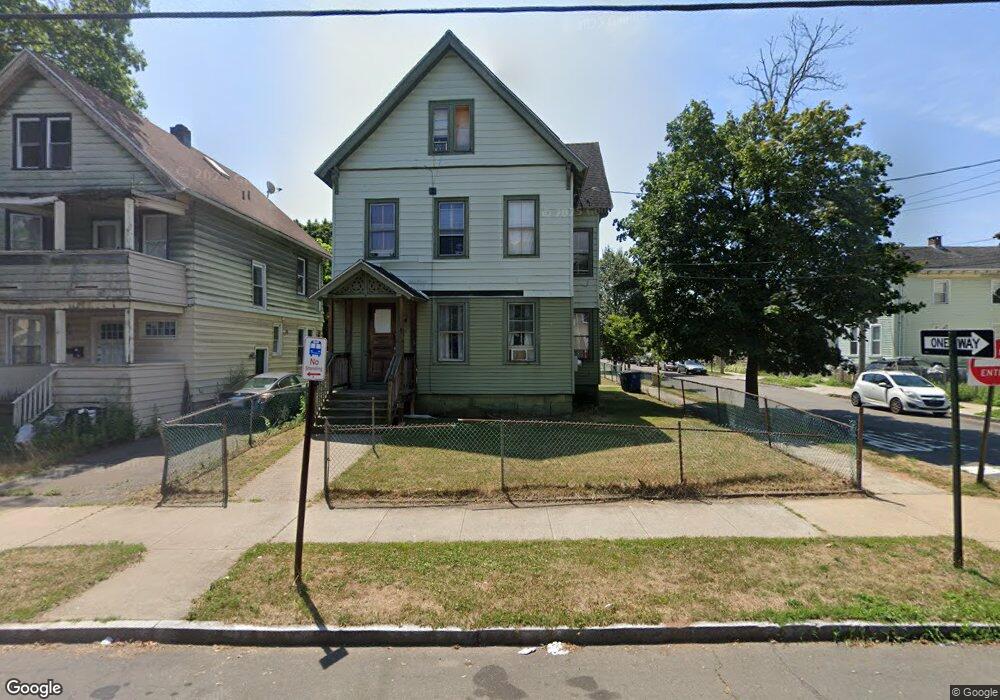
48 Pine St New Haven, CT 06513
Fair Haven NeighborhoodEstimated Value: $384,000 - $552,000
7
Beds
4
Baths
2,675
Sq Ft
$170/Sq Ft
Est. Value
About This Home
This home is located at 48 Pine St, New Haven, CT 06513 and is currently estimated at $455,339, approximately $170 per square foot. 48 Pine St is a home located in New Haven County with nearby schools including Fair Haven School, Elm City College Preparatory School, and All Nations Christian Academy.
Ownership History
Date
Name
Owned For
Owner Type
Purchase Details
Closed on
Jan 16, 1998
Sold by
Shields Stanley and Shields Barbara
Bought by
Nevarez Victor and Gonzalez Maria
Current Estimated Value
Home Financials for this Owner
Home Financials are based on the most recent Mortgage that was taken out on this home.
Original Mortgage
$68,100
Interest Rate
7.08%
Mortgage Type
Unknown
Create a Home Valuation Report for This Property
The Home Valuation Report is an in-depth analysis detailing your home's value as well as a comparison with similar homes in the area
Home Values in the Area
Average Home Value in this Area
Purchase History
| Date | Buyer | Sale Price | Title Company |
|---|---|---|---|
| Nevarez Victor | $70,000 | -- |
Source: Public Records
Mortgage History
| Date | Status | Borrower | Loan Amount |
|---|---|---|---|
| Open | Nevarez Victor | $213,476 | |
| Closed | Nevarez Victor | $135,000 | |
| Closed | Nevarez Victor | $68,100 | |
| Closed | Nevarez Victor | $3,000 |
Source: Public Records
Tax History
| Year | Tax Paid | Tax Assessment Tax Assessment Total Assessment is a certain percentage of the fair market value that is determined by local assessors to be the total taxable value of land and additions on the property. | Land | Improvement |
|---|---|---|---|---|
| 2025 | $7,372 | $187,110 | $46,480 | $140,630 |
| 2024 | $7,204 | $187,110 | $46,480 | $140,630 |
| 2023 | $6,960 | $187,110 | $46,480 | $140,630 |
| 2022 | $7,438 | $187,110 | $46,480 | $140,630 |
| 2021 | $4,924 | $112,210 | $32,760 | $79,450 |
| 2020 | $4,924 | $112,210 | $32,760 | $79,450 |
| 2019 | $4,823 | $112,210 | $32,760 | $79,450 |
| 2018 | $4,823 | $112,210 | $32,760 | $79,450 |
| 2017 | $4,340 | $112,210 | $32,760 | $79,450 |
| 2016 | $3,967 | $95,480 | $28,280 | $67,200 |
| 2015 | $3,967 | $95,480 | $28,280 | $67,200 |
| 2014 | $3,967 | $95,480 | $28,280 | $67,200 |
Source: Public Records
Map
Nearby Homes
- 25 Pine St
- 225 Front St Unit 1
- 111 Pine St
- 147 Lombard St
- 54 Lombard St
- 181 Lombard St
- 702 Quinnipiac Ave Unit A
- 369 Poplar St
- 728 Quinnipiac Ave
- 409 Poplar St
- 383 Lombard St Unit 383
- 100 Front St Unit 100
- 444 Poplar St
- 121 Fillmore St
- 72 Pierpont St
- 314 Lenox St
- 373 Blatchley Ave
- 83 E Grand Ave
- 924 Quinnipiac Ave Unit 7
- 920 Quinnipiac Ave Unit 18
Your Personal Tour Guide
Ask me questions while you tour the home.