48 River St Unit 50 Plainfield, CT 06374
Estimated Value: $307,916 - $368,000
7
Beds
4
Baths
2,597
Sq Ft
$129/Sq Ft
Est. Value
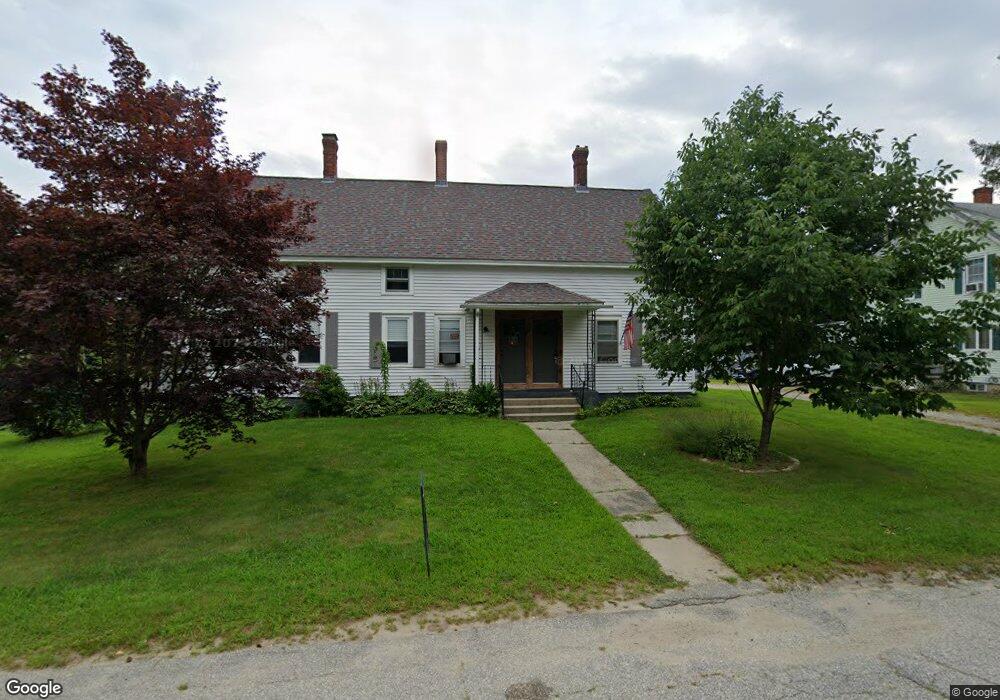
About This Home
This home is located at 48 River St Unit 50, Plainfield, CT 06374 and is currently estimated at $336,229, approximately $129 per square foot. 48 River St Unit 50 is a home located in Windham County with nearby schools including Plainfield Memorial School, Plainfield Central Middle School, and Plainfield High School.
Ownership History
Date
Name
Owned For
Owner Type
Purchase Details
Closed on
Oct 7, 2024
Sold by
Vernon Nathaniel
Bought by
Finnerty Sarah
Current Estimated Value
Home Financials for this Owner
Home Financials are based on the most recent Mortgage that was taken out on this home.
Original Mortgage
$288,000
Outstanding Balance
$284,516
Interest Rate
6.08%
Mortgage Type
Stand Alone Refi Refinance Of Original Loan
Estimated Equity
$51,713
Purchase Details
Closed on
Jun 15, 2020
Sold by
Smith Patrick J
Bought by
Vernon Nathaniel
Home Financials for this Owner
Home Financials are based on the most recent Mortgage that was taken out on this home.
Original Mortgage
$216,354
Interest Rate
3.2%
Mortgage Type
New Conventional
Purchase Details
Closed on
Sep 30, 1996
Sold by
Smith Mary Ann
Bought by
Smith Patrick J and Smith Michael S
Create a Home Valuation Report for This Property
The Home Valuation Report is an in-depth analysis detailing your home's value as well as a comparison with similar homes in the area
Home Values in the Area
Average Home Value in this Area
Purchase History
| Date | Buyer | Sale Price | Title Company |
|---|---|---|---|
| Finnerty Sarah | -- | None Available | |
| Finnerty Sarah | -- | None Available | |
| Finnerty Sarah | -- | None Available | |
| Vernon Nathaniel | $211,500 | None Available | |
| Vernon Nathaniel | $211,500 | None Available | |
| Vernon Nathaniel | $211,500 | None Available | |
| Smith Patrick J | $110,000 | -- | |
| Smith Patrick J | $110,000 | -- |
Source: Public Records
Mortgage History
| Date | Status | Borrower | Loan Amount |
|---|---|---|---|
| Open | Finnerty Sarah | $288,000 | |
| Closed | Finnerty Sarah | $288,000 | |
| Previous Owner | Vernon Nathaniel | $216,354 | |
| Previous Owner | Smith Patrick J | $102,400 | |
| Previous Owner | Smith Patrick J | $120,000 |
Source: Public Records
Tax History
| Year | Tax Paid | Tax Assessment Tax Assessment Total Assessment is a certain percentage of the fair market value that is determined by local assessors to be the total taxable value of land and additions on the property. | Land | Improvement |
|---|---|---|---|---|
| 2025 | $3,874 | $164,090 | $28,870 | $135,220 |
| 2024 | $3,451 | $149,700 | $28,870 | $120,830 |
| 2023 | $3,434 | $149,700 | $28,870 | $120,830 |
| 2022 | $4,489 | $107,290 | $26,210 | $81,080 |
| 2021 | $3,297 | $107,290 | $26,210 | $81,080 |
| 2020 | $3,276 | $107,290 | $26,210 | $81,080 |
| 2019 | $3,276 | $107,290 | $26,210 | $81,080 |
| 2018 | $3,225 | $107,290 | $26,210 | $81,080 |
| 2017 | $3,165 | $98,830 | $26,210 | $72,620 |
| 2016 | $3,059 | $98,830 | $26,210 | $72,620 |
| 2015 | $2,981 | $98,830 | $26,210 | $72,620 |
| 2014 | $2,981 | $98,830 | $26,210 | $72,620 |
Source: Public Records
Map
Nearby Homes
- 29 Union St
- 6 Grace Ln
- 10 Grace Ln
- 12 Mechanic St
- 73 Sterling Hill Rd
- 58 Milner Ave
- 143 Goshen Rd
- 100 Squaw Rock Rd
- 45 Main St
- 133 Sachem Dr
- 30 Main St
- 13 Henry Dr
- 0 Putnam Rd Unit 24147722
- 25 Snake Meadow Rd
- 25 Torrey Ln
- 10 Texas Heights Rd
- 277 Moosup Pond Rd
- 47 Texas Heights Rd
- 41-45 Grove St
- 169 Moosup Pond Rd
- 48-50 River St
- 44 River St Unit 46
- 54 River St Unit 56
- 51 River St
- 58 River St Unit 60
- 62 River St Unit 64
- 55 Cranska Oaks Rd Unit 57
- 4 Village Center Cir
- 20 Main St
- 28 Main St
- 68 River St
- 24 Main St
- 63 Cranska Oaks Rd Unit 65
- 10-16 Main St
- 51 Cranska Oaks Rd
- 0 Prospect and Allyn St
- 5 S Main St
- 39-43 Main St
- 39 Main St Unit 43
- 15 Main St
Your Personal Tour Guide
Ask me questions while you tour the home.