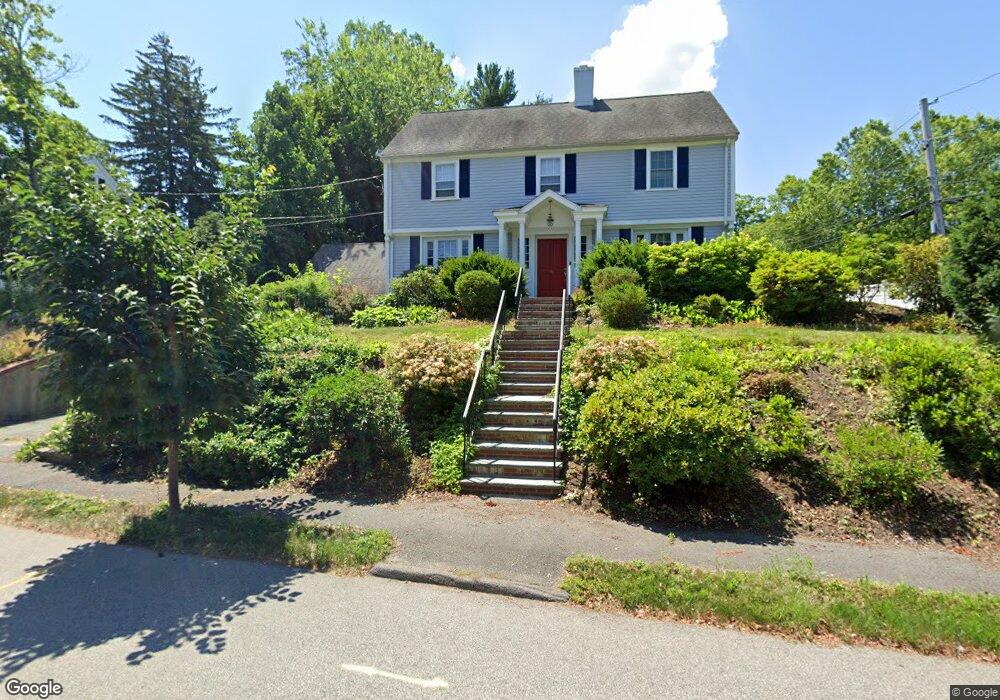
48 Ruthven Rd Newton, MA 02458
Newton Corner NeighborhoodEstimated Value: $1,802,000 - $2,129,000
3
Beds
3
Baths
2,238
Sq Ft
$872/Sq Ft
Est. Value
About This Home
This home is located at 48 Ruthven Rd, Newton, MA 02458 and is currently estimated at $1,951,984, approximately $872 per square foot. 48 Ruthven Rd is a home located in Middlesex County with nearby schools including Underwood Elementary School, Bigelow Middle School, and Newton North High School.
Ownership History
Date
Name
Owned For
Owner Type
Purchase Details
Closed on
Jun 13, 2013
Sold by
Marcus David L and Marcus Rachel
Bought by
David L Marcus T and Marcus David L
Current Estimated Value
Purchase Details
Closed on
Aug 1, 1982
Bought by
David L T and Rachel Marcus T
Create a Home Valuation Report for This Property
The Home Valuation Report is an in-depth analysis detailing your home's value as well as a comparison with similar homes in the area
Home Values in the Area
Average Home Value in this Area
Purchase History
| Date | Buyer | Sale Price | Title Company |
|---|---|---|---|
| David L Marcus T | -- | -- | |
| David L T | $140,000 | -- |
Source: Public Records
Mortgage History
| Date | Status | Borrower | Loan Amount |
|---|---|---|---|
| Previous Owner | David L T | $120,000 | |
| Previous Owner | David L T | $180,000 | |
| Previous Owner | David L T | $180,000 |
Source: Public Records
Tax History Compared to Growth
Tax History
| Year | Tax Paid | Tax Assessment Tax Assessment Total Assessment is a certain percentage of the fair market value that is determined by local assessors to be the total taxable value of land and additions on the property. | Land | Improvement |
|---|---|---|---|---|
| 2025 | $15,852 | $1,617,500 | $1,349,500 | $268,000 |
| 2024 | $15,327 | $1,570,400 | $1,310,200 | $260,200 |
| 2023 | $14,497 | $1,424,100 | $1,002,900 | $421,200 |
| 2022 | $13,872 | $1,318,600 | $928,600 | $390,000 |
| 2021 | $13,385 | $1,244,000 | $876,000 | $368,000 |
| 2020 | $12,987 | $1,244,000 | $876,000 | $368,000 |
| 2019 | $12,622 | $1,207,800 | $850,500 | $357,300 |
| 2018 | $12,173 | $1,125,000 | $771,700 | $353,300 |
| 2017 | $11,802 | $1,061,300 | $728,000 | $333,300 |
| 2016 | $11,288 | $991,900 | $680,400 | $311,500 |
| 2015 | $10,762 | $927,000 | $635,900 | $291,100 |
Source: Public Records
Map
Nearby Homes
- 206 Franklin St
- 59 Hyde Ave
- 642 Centre St
- 35 George St Unit 35
- 37 George St Unit 37
- 686 Centre St
- 106 Farlow Rd
- 548 Centre St Unit 5
- 68 Vernon St
- 14 Summit St
- 9 Baldwin St Unit 15C
- 12 Richardson St Unit 14
- 121 Tremont St Unit B1
- 70 Washington St Unit 70
- 70 Washington St
- 99 Tremont St Unit 105
- 99 Tremont St Unit 413
- 21 Glenley Terrace
- 159 Washington St Unit 4
- 65-67 Saint James Cir