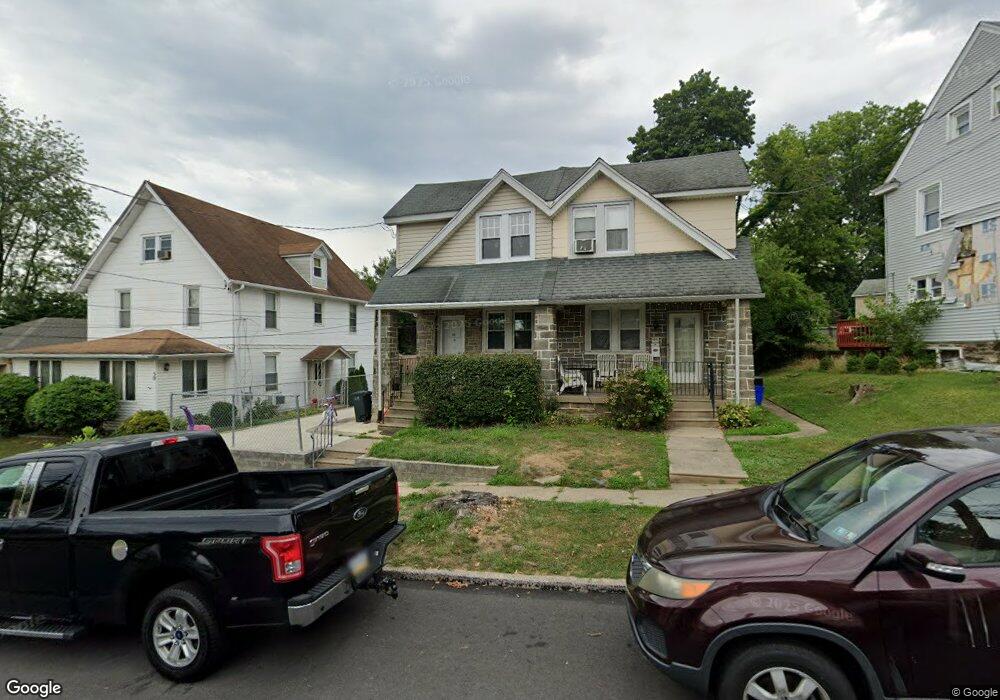
48 S Pennock Ave Upper Darby, PA 19082
Estimated Value: $121,000 - $274,000
3
Beds
1
Bath
1,238
Sq Ft
$163/Sq Ft
Est. Value
About This Home
This home is located at 48 S Pennock Ave, Upper Darby, PA 19082 and is currently estimated at $202,168, approximately $163 per square foot. 48 S Pennock Ave is a home located in Delaware County with nearby schools including Drexel Hill Middle School, Upper Darby High School, and West Philadelphia Achievement Charter Elementary School.
Ownership History
Date
Name
Owned For
Owner Type
Purchase Details
Closed on
Sep 22, 2014
Sold by
Delaney Kostiuk Melissa and Kostiuk Sergio P
Bought by
Li Yanlan
Current Estimated Value
Purchase Details
Closed on
Feb 25, 2004
Sold by
Klenk Stephen J and Foster Heather A
Bought by
Kostiuk Melissa Delaney and Kostiuk Sergio P
Home Financials for this Owner
Home Financials are based on the most recent Mortgage that was taken out on this home.
Original Mortgage
$103,250
Interest Rate
5.62%
Mortgage Type
Purchase Money Mortgage
Purchase Details
Closed on
Mar 26, 2002
Sold by
Duffy Aida
Bought by
Klenk Stephen J and Foster Heather A
Home Financials for this Owner
Home Financials are based on the most recent Mortgage that was taken out on this home.
Original Mortgage
$92,270
Interest Rate
6.88%
Mortgage Type
FHA
Purchase Details
Closed on
Feb 20, 1995
Sold by
Duffy Christopher D and Duffy Aida
Bought by
Duffy Aida
Create a Home Valuation Report for This Property
The Home Valuation Report is an in-depth analysis detailing your home's value as well as a comparison with similar homes in the area
Home Values in the Area
Average Home Value in this Area
Purchase History
| Date | Buyer | Sale Price | Title Company |
|---|---|---|---|
| Li Yanlan | $45,500 | None Available | |
| Kostiuk Melissa Delaney | $114,746 | -- | |
| Klenk Stephen J | $93,000 | Commonwealth Land Title Ins | |
| Duffy Aida | -- | -- |
Source: Public Records
Mortgage History
| Date | Status | Borrower | Loan Amount |
|---|---|---|---|
| Previous Owner | Kostiuk Melissa Delaney | $103,250 | |
| Previous Owner | Klenk Stephen J | $92,270 |
Source: Public Records
Tax History Compared to Growth
Tax History
| Year | Tax Paid | Tax Assessment Tax Assessment Total Assessment is a certain percentage of the fair market value that is determined by local assessors to be the total taxable value of land and additions on the property. | Land | Improvement |
|---|---|---|---|---|
| 2025 | $4,291 | $101,460 | $38,460 | $63,000 |
| 2024 | $4,291 | $101,460 | $38,460 | $63,000 |
| 2023 | $4,250 | $101,460 | $38,460 | $63,000 |
| 2022 | $4,136 | $101,460 | $38,460 | $63,000 |
| 2021 | $5,577 | $101,460 | $38,460 | $63,000 |
| 2020 | $3,180 | $49,155 | $27,640 | $21,515 |
| 2019 | $3,124 | $49,155 | $27,640 | $21,515 |
| 2018 | $3,088 | $49,155 | $0 | $0 |
| 2017 | $3,008 | $49,155 | $0 | $0 |
| 2016 | $270 | $49,155 | $0 | $0 |
| 2015 | $270 | $49,155 | $0 | $0 |
| 2014 | $270 | $79,400 | $0 | $0 |
Source: Public Records
Map
Nearby Homes
- 7226 Penarth Ave
- 46 S State Rd
- 7920 W Chester Pike
- 25 N Pennock Ave
- 105 N Fairview Ave
- 207 Berbro Ave
- 11 S Cedar Ln
- 9 Berbro Ave
- 7409 Miller Ave
- 8125 W Chester Pike Unit A4
- 18 Elm Ave
- 24 Sunshine Rd
- 7502 Parkview Rd
- 171 N Carol Blvd
- 107 S Keystone Ave
- 7011 Hazel Ave
- 241 S Cedar Ln
- 105 Academy Ln
- 201 Saint Laurence Rd
- 512 Fairfield Ave
- 44 S Pennock Ave
- 50 S Pennock Ave
- 40 S Pennock Ave
- 54 S Pennock Ave
- 30 S Pennock Ave
- 33 S Fairview Ave
- 33 S Fairview Ave Unit 3
- 31 S Fairview Ave
- 26 S Pennock Ave
- 39 S Fairview Ave
- 41 S Pennock Ave
- 45 S Pennock Ave
- 39 S Pennock Ave
- 21 S Fairview Ave
- 22 S Pennock Ave
- 41 S Fairview Ave
- 19 S Fairview Ave
- 47 S Pennock Ave
- 37 S Pennock Ave
- 43 S Fairview Ave