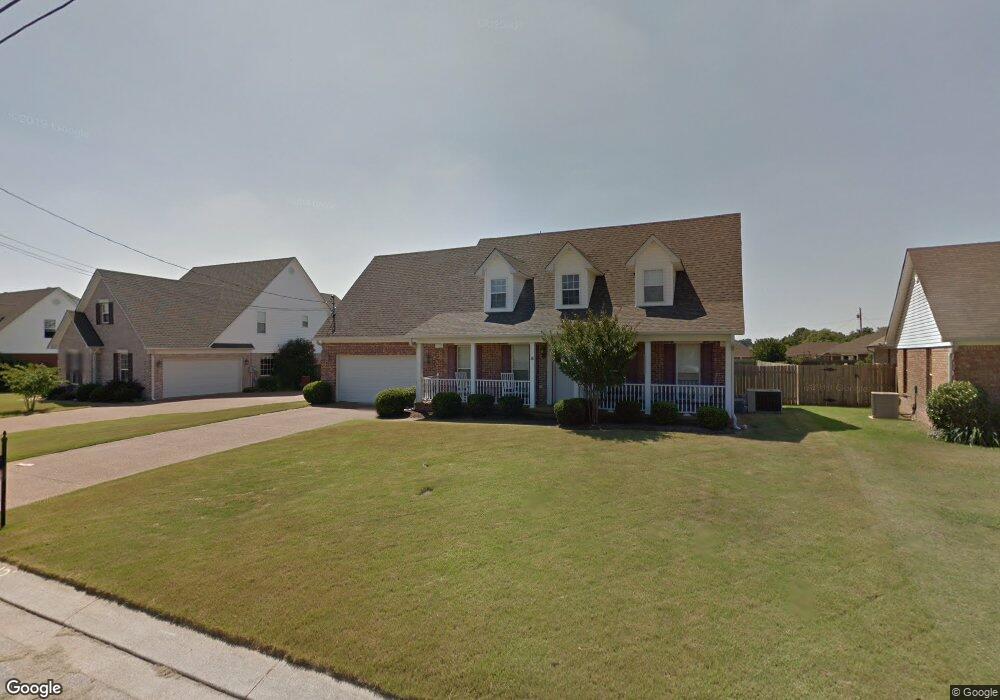
48 Sebastian Dr Jackson, TN 38305
Estimated Value: $302,000 - $349,000
Studio
4
Baths
3,023
Sq Ft
$108/Sq Ft
Est. Value
About This Home
This home is located at 48 Sebastian Dr, Jackson, TN 38305 and is currently estimated at $327,043, approximately $108 per square foot. 48 Sebastian Dr is a home located in Madison County with nearby schools including Pope School, Northeast Middle School, and North Side High School.
Ownership History
Date
Name
Owned For
Owner Type
Purchase Details
Closed on
Sep 3, 2002
Sold by
Premier Homes & Const Inc
Bought by
Antonio White
Current Estimated Value
Home Financials for this Owner
Home Financials are based on the most recent Mortgage that was taken out on this home.
Original Mortgage
$149,000
Outstanding Balance
$61,171
Interest Rate
6.4%
Estimated Equity
$265,872
Purchase Details
Closed on
Apr 9, 2002
Sold by
Etal Winberry Jerry E
Bought by
Premier Homes & Constructi
Home Financials for this Owner
Home Financials are based on the most recent Mortgage that was taken out on this home.
Original Mortgage
$116,000
Interest Rate
6.89%
Create a Home Valuation Report for This Property
The Home Valuation Report is an in-depth analysis detailing your home's value as well as a comparison with similar homes in the area
Purchase History
| Date | Buyer | Sale Price | Title Company |
|---|---|---|---|
| Antonio White | $149,000 | -- | |
| Premier Homes & Constructi | $19,000 | -- |
Source: Public Records
Mortgage History
| Date | Status | Borrower | Loan Amount |
|---|---|---|---|
| Open | Premier Homes & Constructi | $149,000 | |
| Previous Owner | Premier Homes & Constructi | $116,000 |
Source: Public Records
Tax History
| Year | Tax Paid | Tax Assessment Tax Assessment Total Assessment is a certain percentage of the fair market value that is determined by local assessors to be the total taxable value of land and additions on the property. | Land | Improvement |
|---|---|---|---|---|
| 2025 | $1,167 | $62,275 | $7,500 | $54,775 |
| 2024 | $1,167 | $62,275 | $7,500 | $54,775 |
| 2022 | $2,171 | $62,275 | $7,500 | $54,775 |
| 2021 | $1,734 | $40,200 | $5,125 | $35,075 |
| 2020 | $1,734 | $40,200 | $5,125 | $35,075 |
| 2019 | $1,734 | $40,200 | $5,125 | $35,075 |
| 2018 | $1,734 | $40,200 | $5,125 | $35,075 |
| 2017 | $1,489 | $33,750 | $5,125 | $28,625 |
| 2016 | $1,388 | $33,750 | $5,125 | $28,625 |
| 2015 | $1,388 | $33,750 | $5,125 | $28,625 |
| 2014 | $1,388 | $33,750 | $5,125 | $28,625 |
Source: Public Records
Map
Nearby Homes
- 204 Rooker Dr
- 25 Noah
- 9 Grove Hill Ln
- 17 Noah Cove
- 126 Isaiah Dr
- 24 Enoch Cove
- 141 Roxbury Dr
- 9 Caleb Cove
- 23 Matrix Cove
- 11 Rockford Dr
- 24 Engel Cove
- 35 Rockford Dr
- 15 Engel Cove
- 6 Creekbend Cove
- 15 Creekbend Cove
- 24 Creekbend Cove
- 18 Creekbend Cove
- 00 U S 45 Bypass
- 106 N Spring Dr
- 57 Lake Point Dr
Your Personal Tour Guide
Ask me questions while you tour the home.