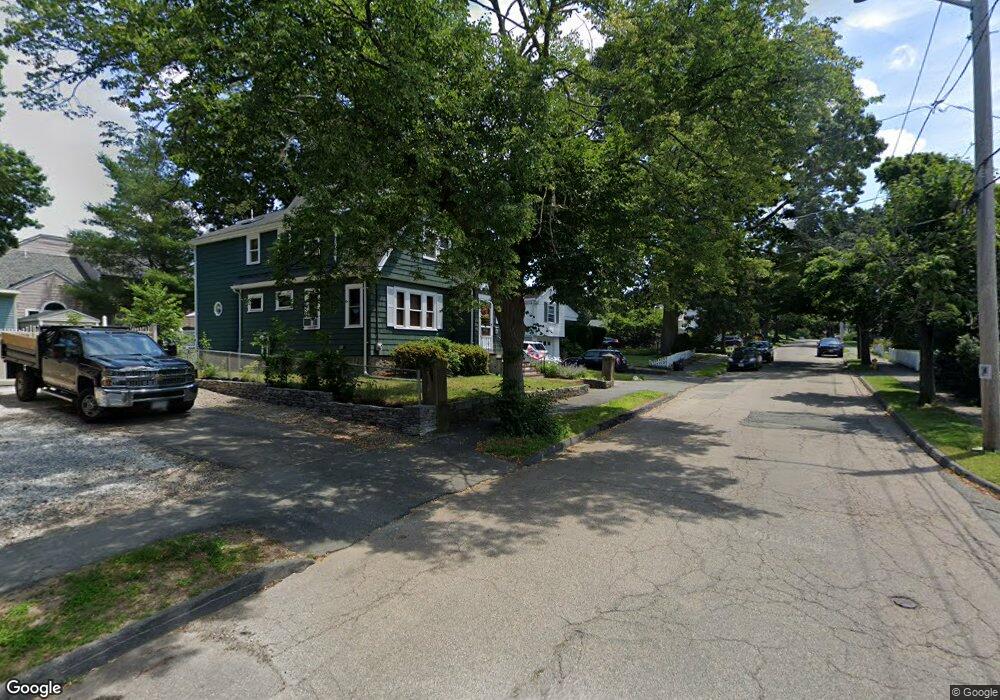
48 Shawmut St Quincy, MA 02169
Estimated Value: $558,000 - $725,000
2
Beds
1
Bath
1,013
Sq Ft
$630/Sq Ft
Est. Value
About This Home
This home is located at 48 Shawmut St, Quincy, MA 02169 and is currently estimated at $638,126, approximately $629 per square foot. 48 Shawmut St is a home located in Norfolk County with nearby schools including Montclair Elementary School, Atlantic Middle School, and North Quincy High School.
Ownership History
Date
Name
Owned For
Owner Type
Purchase Details
Closed on
Oct 29, 1999
Sold by
Dandrea M Pearl
Bought by
Lofstedt Magdalena H
Current Estimated Value
Home Financials for this Owner
Home Financials are based on the most recent Mortgage that was taken out on this home.
Original Mortgage
$115,000
Outstanding Balance
$35,189
Interest Rate
7.78%
Mortgage Type
Purchase Money Mortgage
Estimated Equity
$602,937
Create a Home Valuation Report for This Property
The Home Valuation Report is an in-depth analysis detailing your home's value as well as a comparison with similar homes in the area
Purchase History
| Date | Buyer | Sale Price | Title Company |
|---|---|---|---|
| Lofstedt Magdalena H | $154,900 | -- |
Source: Public Records
Mortgage History
| Date | Status | Borrower | Loan Amount |
|---|---|---|---|
| Open | Lofstedt Magdalena H | $115,000 |
Source: Public Records
Tax History Compared to Growth
Tax History
| Year | Tax Paid | Tax Assessment Tax Assessment Total Assessment is a certain percentage of the fair market value that is determined by local assessors to be the total taxable value of land and additions on the property. | Land | Improvement |
|---|---|---|---|---|
| 2025 | $5,375 | $466,200 | $271,900 | $194,300 |
| 2024 | $4,994 | $443,100 | $258,900 | $184,200 |
| 2023 | $4,751 | $426,900 | $246,600 | $180,300 |
| 2022 | $4,212 | $351,600 | $197,300 | $154,300 |
| 2021 | $4,073 | $335,500 | $197,300 | $138,200 |
| 2020 | $3,989 | $320,900 | $197,300 | $123,600 |
| 2019 | $3,735 | $297,600 | $191,500 | $106,100 |
| 2018 | $3,632 | $272,300 | $177,300 | $95,000 |
| 2017 | $3,592 | $253,500 | $168,900 | $84,600 |
| 2016 | $3,386 | $235,800 | $153,500 | $82,300 |
| 2015 | $3,249 | $222,500 | $144,800 | $77,700 |
| 2014 | $3,277 | $220,500 | $144,800 | $75,700 |
Source: Public Records
Map
Nearby Homes
- 141 Gardiner Rd
- 111 Shawmut St
- 135 Willard St Unit 8
- 71 Governors Rd
- 41 Wallace Rd
- 312 Edge Hill Rd
- 46 Century Ln
- 10 White St
- 18 Eaton St
- 639 Pleasant St Unit 639
- 639 Pleasant St
- 397 Adams St
- 400 Adams St Unit A
- 171 Milton St
- 406 Beale St
- 123 Piermont St
- 211 Copeland St
- 510 Willard St
- 179 Harvard St
- 65 Barham Ave