Estimated Value: $207,209 - $234,000
2
Beds
3
Baths
1,440
Sq Ft
$150/Sq Ft
Est. Value
About This Home
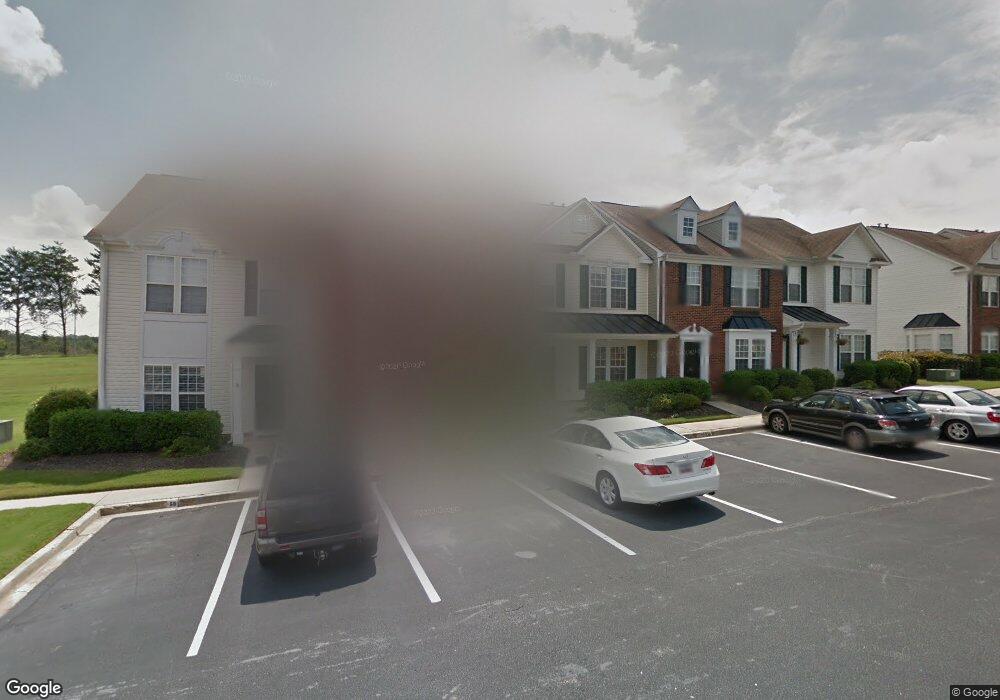
This home is located at 48 Spring Crossing Cir, Greer, SC 29650 and is currently estimated at $216,302, approximately $150 per square foot. 48 Spring Crossing Cir is a home located in Greenville County with nearby schools including Woodland Elementary School, Riverside Middle School, and Riverside High School.
Ownership History
Date
Name
Owned For
Owner Type
Purchase Details
Closed on
Jun 15, 2010
Sold by
Durham Takella and Dodd Takella N
Bought by
Durham Takella Dodd and Durham Ramaro D
Current Estimated Value
Home Financials for this Owner
Home Financials are based on the most recent Mortgage that was taken out on this home.
Original Mortgage
$104,946
Interest Rate
4.5%
Mortgage Type
FHA
Purchase Details
Closed on
Mar 24, 2006
Sold by
Edwards Carmen
Bought by
Dodd Takella N
Home Financials for this Owner
Home Financials are based on the most recent Mortgage that was taken out on this home.
Original Mortgage
$83,120
Interest Rate
6.19%
Mortgage Type
Purchase Money Mortgage
Purchase Details
Closed on
Aug 26, 2002
Sold by
Mitchell Christopher A
Bought by
Edwards Carmen
Purchase Details
Closed on
Dec 20, 2000
Sold by
R Inc
Bought by
Tchell Christopher A
Create a Home Valuation Report for This Property
The Home Valuation Report is an in-depth analysis detailing your home's value as well as a comparison with similar homes in the area
Home Values in the Area
Average Home Value in this Area
Purchase History
| Date | Buyer | Sale Price | Title Company |
|---|---|---|---|
| Durham Takella Dodd | -- | -- | |
| Dodd Takella N | $103,900 | None Available | |
| Edwards Carmen | $97,800 | -- | |
| Tchell Christopher A | $96,170 | -- |
Source: Public Records
Mortgage History
| Date | Status | Borrower | Loan Amount |
|---|---|---|---|
| Closed | Durham Takella Dodd | $104,946 | |
| Closed | Dodd Takella N | $83,120 |
Source: Public Records
Tax History
| Year | Tax Paid | Tax Assessment Tax Assessment Total Assessment is a certain percentage of the fair market value that is determined by local assessors to be the total taxable value of land and additions on the property. | Land | Improvement |
|---|---|---|---|---|
| 2025 | $2,731 | $7,480 | $1,550 | $5,930 |
| 2024 | $2,731 | $6,510 | $1,040 | $5,470 |
| 2023 | $2,572 | $6,510 | $1,040 | $5,470 |
| 2022 | $2,382 | $6,510 | $1,040 | $5,470 |
| 2021 | $2,348 | $6,510 | $1,040 | $5,470 |
| 2020 | $2,125 | $5,660 | $900 | $4,760 |
| 2019 | $2,126 | $5,660 | $900 | $4,760 |
| 2018 | $859 | $3,770 | $600 | $3,170 |
| 2017 | $856 | $3,770 | $600 | $3,170 |
| 2016 | $823 | $94,270 | $15,000 | $79,270 |
| 2015 | $898 | $94,270 | $15,000 | $79,270 |
| 2014 | $992 | $105,720 | $17,500 | $88,220 |
Source: Public Records
Map
Nearby Homes
- 145 Spring Crossing Cir
- 220 Spring Crossing Cir
- 133 Fawnbrook Dr
- 8 Sunfield Ct
- 6 Kylemore Ln
- 34 Swade Way
- 208 Elise Dr
- 100 Grey Oak Trail
- 210 Alderside Place
- 12 Sabine Leaf Ct
- 126 Middleby Way
- 519 Longview Terrace
- 310 Cumulus Ct
- 44 Riley Eden Ln
- 116 Brushy Hollow Ln
- 76 Riley Eden Ln Unit Site 1
- 68 Riley Eden Ln Unit Site 3
- 109 Hammett Grove Ln
- 300 Mansfield Ln
- 2 Allenwood Ln
- 46 Spring Crossing Cir
- 50 Spring Crossing Cir
- 44 Spring Crossing Cir
- 42 Spring Crossing Cir
- 52 Spring Crossing Cir
- 54 Spring Crossing Cir
- 56 Spring Crossing Cir
- 40 Spring Crossing Cir
- 38 Spring Crossing Cir
- 60 Spring Crossing Cir
- 36 Spring Crossing Cir
- 70 Spring Crossing Cir
- 68 Spring Crossing Cir
- 34 Spring Crossing Cir
- 66 Spring Crossing Cir
- 66 Spring Crossing Cir
- 64 Spring Crossing Cir
- 64 Spring Crossing Cir
- 64 Gr-Pd-51
- 62 Spring Crossing Cir
Your Personal Tour Guide
Ask me questions while you tour the home.