
Seller's Agent in 2024
Dan Schachter
DCS Real Estate, LLC
(413) 626-6992
5 in this area
105 Total Sales
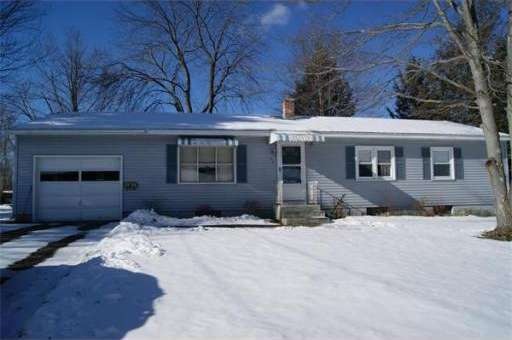

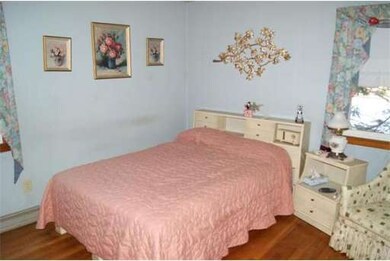


This lovely 4 bedroom Ranch is in a neighborhood that is near Look Park, schools, bike path, downtown Florence and close to all your shopping needs. 1.5 baths, kitchen with eat in area, hardwood floors and attached garage.
Last Agent to Sell the Property
Canon Real Estate, Inc. License #452506081 Listed on: 02/03/2013
Home Type
Single Family
Est. Annual Taxes
$5,830
Year Built
1958
Lot Details
0
| Date | Type | Sale Price | Title Company |
|---|---|---|---|
| Not Resolvable | $230,000 | -- |
| Date | Status | Loan Amount | Loan Type |
|---|---|---|---|
| Open | $130,000 | New Conventional | |
| Closed | $130,000 | New Conventional |
| Date | Event | Price | Change | Sq Ft Price |
|---|---|---|---|---|
| 06/24/2024 06/24/24 | Sold | $515,000 | +25.6% | $413 / Sq Ft |
| 05/13/2024 05/13/24 | Pending | -- | -- | -- |
| 05/06/2024 05/06/24 | For Sale | $410,000 | +78.3% | $329 / Sq Ft |
| 04/04/2013 04/04/13 | Sold | $230,000 | -2.1% | $184 / Sq Ft |
| 04/04/2013 04/04/13 | Pending | -- | -- | -- |
| 02/03/2013 02/03/13 | For Sale | $235,000 | -- | $188 / Sq Ft |
| Year | Tax Paid | Tax Assessment Tax Assessment Total Assessment is a certain percentage of the fair market value that is determined by local assessors to be the total taxable value of land and additions on the property. | Land | Improvement |
|---|---|---|---|---|
| 2025 | $5,830 | $418,500 | $122,700 | $295,800 |
| 2024 | $5,280 | $347,600 | $122,700 | $224,900 |
| 2023 | $5,397 | $340,700 | $111,500 | $229,200 |
| 2022 | $4,775 | $266,900 | $111,500 | $155,400 |
| 2021 | $4,210 | $242,400 | $106,500 | $135,900 |
| 2020 | $4,072 | $242,400 | $106,500 | $135,900 |
| 2019 | $3,700 | $213,000 | $91,500 | $121,500 |
| 2018 | $3,746 | $219,100 | $91,500 | $127,600 |
| 2017 | $3,657 | $219,100 | $91,500 | $127,600 |
| 2016 | $3,541 | $219,100 | $91,500 | $127,600 |
| 2015 | $3,364 | $212,900 | $91,500 | $121,400 |
| 2014 | $3,298 | $214,300 | $91,500 | $122,800 |
Seller's Agent in 2024
Dan Schachter
DCS Real Estate, LLC
(413) 626-6992
5 in this area
105 Total Sales
Buyer's Agent in 2024
Craig Della Penna
The Murphys REALTORS® , Inc.
(413) 584-5521
5 in this area
78 Total Sales
Seller's Agent in 2013
John Pompei
Canon Real Estate, Inc.
(413) 535-6631
4 Total Sales
Source: MLS Property Information Network (MLS PIN)
MLS Number: 71478815
APN: NHAM-000012C-000036-000001
Disclaimer: Certain information contained herein is derived from information provided by parties other than Homes.com. All information provided is deemed reliable, but is not guaranteed to be accurate and should be independently verified.
![]() The property listing data and information, or the Images, set forth herein were provided to MLS Property Information Network, Inc. from third party sources, including sellers, lessors and public records, and were compiled by MLS Property Information Network, Inc. The property listing data and information, and the Images, are for the personal, non-commercial use of consumers having a good faith interest in purchasing or leasing listed properties of the type displayed to them and may not be used for any purpose other than to identify prospective properties which such consumers may have a good faith interest in purchasing or leasing. MLS Property Information Network, Inc. and its subscribers disclaim any and all representations and warranties as to the accuracy of the property listing data and information, or as to the accuracy of any of the Images, set forth herein.
The property listing data and information, or the Images, set forth herein were provided to MLS Property Information Network, Inc. from third party sources, including sellers, lessors and public records, and were compiled by MLS Property Information Network, Inc. The property listing data and information, and the Images, are for the personal, non-commercial use of consumers having a good faith interest in purchasing or leasing listed properties of the type displayed to them and may not be used for any purpose other than to identify prospective properties which such consumers may have a good faith interest in purchasing or leasing. MLS Property Information Network, Inc. and its subscribers disclaim any and all representations and warranties as to the accuracy of the property listing data and information, or as to the accuracy of any of the Images, set forth herein.