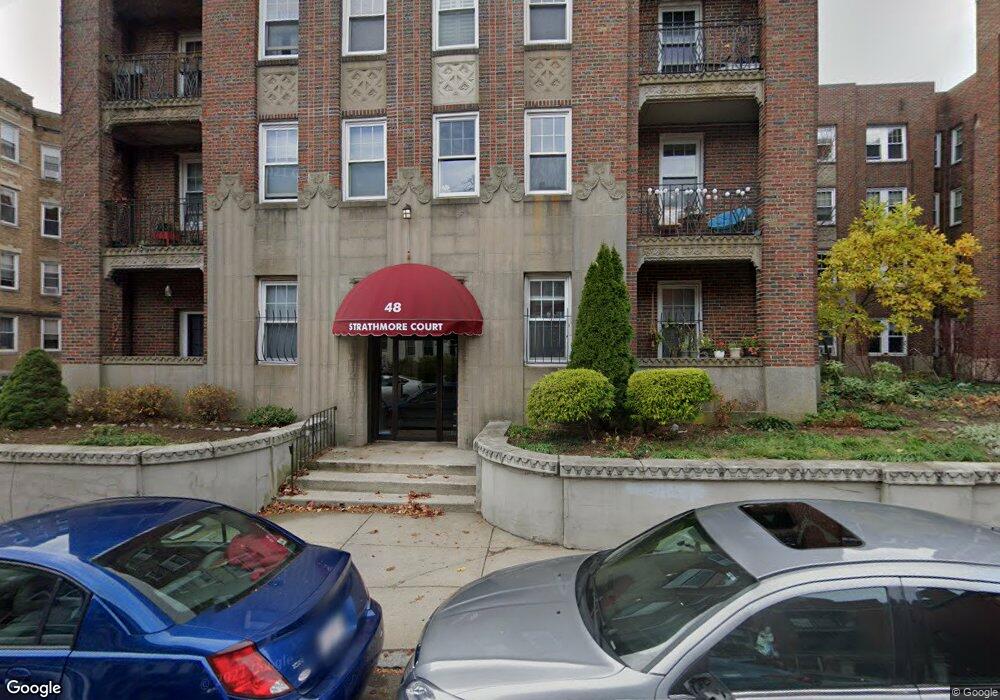
48 Strathmore Rd Unit 46 Brighton, MA 02135
Commonwealth NeighborhoodEstimated Value: $417,000 - $443,000
1
Bed
1
Bath
650
Sq Ft
$659/Sq Ft
Est. Value
About This Home
This home is located at 48 Strathmore Rd Unit 46, Brighton, MA 02135 and is currently estimated at $428,089, approximately $658 per square foot. 48 Strathmore Rd Unit 46 is a home located in Suffolk County with nearby schools including Torah Academy, Bais Yaakov Of Boston High School, and Yeshiva Ohr Yisrael High School for Boys.
Ownership History
Date
Name
Owned For
Owner Type
Purchase Details
Closed on
Dec 28, 2011
Sold by
Ettinger-Park-Two Ret
Bought by
Park Elyse R and Ettinger Mark H
Current Estimated Value
Purchase Details
Closed on
Sep 17, 2007
Sold by
Park Elyse R
Bought by
Ettinger Park Two Rt
Purchase Details
Closed on
Aug 22, 2001
Sold by
Hautanen Sandra
Bought by
Park Elyse R
Home Financials for this Owner
Home Financials are based on the most recent Mortgage that was taken out on this home.
Original Mortgage
$148,800
Interest Rate
7.21%
Mortgage Type
Purchase Money Mortgage
Purchase Details
Closed on
Jan 27, 1988
Sold by
Bernet George A
Bought by
Hautanen Sandra L
Home Financials for this Owner
Home Financials are based on the most recent Mortgage that was taken out on this home.
Original Mortgage
$91,200
Interest Rate
10.65%
Mortgage Type
Purchase Money Mortgage
Create a Home Valuation Report for This Property
The Home Valuation Report is an in-depth analysis detailing your home's value as well as a comparison with similar homes in the area
Home Values in the Area
Average Home Value in this Area
Purchase History
| Date | Buyer | Sale Price | Title Company |
|---|---|---|---|
| Park Elyse R | -- | -- | |
| Ettinger Park Two Rt | -- | -- | |
| Park Elyse R | $186,000 | -- | |
| Hautanen Sandra L | $114,000 | -- |
Source: Public Records
Mortgage History
| Date | Status | Borrower | Loan Amount |
|---|---|---|---|
| Previous Owner | Hautanen Sandra L | $25,000 | |
| Previous Owner | Hautanen Sandra L | $168,750 | |
| Previous Owner | Hautanen Sandra L | $148,800 | |
| Previous Owner | Hautanen Sandra L | $91,200 |
Source: Public Records
Tax History Compared to Growth
Tax History
| Year | Tax Paid | Tax Assessment Tax Assessment Total Assessment is a certain percentage of the fair market value that is determined by local assessors to be the total taxable value of land and additions on the property. | Land | Improvement |
|---|---|---|---|---|
| 2025 | $4,426 | $382,200 | $0 | $382,200 |
| 2024 | $4,163 | $381,900 | $0 | $381,900 |
| 2023 | $4,102 | $381,900 | $0 | $381,900 |
| 2022 | $3,920 | $360,300 | $0 | $360,300 |
| 2021 | $3,809 | $357,000 | $0 | $357,000 |
| 2020 | $3,616 | $342,400 | $0 | $342,400 |
| 2019 | $3,538 | $335,700 | $0 | $335,700 |
| 2018 | $3,290 | $313,900 | $0 | $313,900 |
| 2017 | $3,079 | $290,700 | $0 | $290,700 |
| 2016 | $2,934 | $266,700 | $0 | $266,700 |
| 2015 | $2,839 | $234,400 | $0 | $234,400 |
| 2014 | $2,680 | $213,000 | $0 | $213,000 |
Source: Public Records
Map
Nearby Homes
- 19-21 Orkney Rd
- 1898 Beacon St Unit 4
- 47 Englewood Ave
- 65 Strathmore Rd Unit 49
- 4 Kilsyth Terrace Unit 32
- 155 Kilsyth Rd
- 1856 Beacon St Unit 2C
- 31 Orkney Rd Unit 54
- 41 Orkney Rd
- 40 Orkney Rd Unit 1
- 17 Strathmore Rd Unit 2
- 44 Orkney Rd Unit 3
- 140 Kilsyth Rd Unit 8
- 23 Englewood Ave Unit 4
- 88 Strathmore Rd Unit 7
- 56-58 Selkirk Rd
- 8 Strathmore Rd Unit G
- 6 Sutherland Rd Unit 41
- 15 Colliston Rd Unit 6
- 38 Kilsyth Rd Unit 21
- 48 Strathmore Rd Unit 47
- 48 Strathmore Rd Unit 45
- 48 Strathmore Rd Unit 44
- 48 Strathmore Rd Unit 43
- 48 Strathmore Rd Unit 42
- 48 Strathmore Rd Unit 41
- 48 Strathmore Rd Unit 37
- 48 Strathmore Rd Unit 36
- 48 Strathmore Rd Unit 35
- 48 Strathmore Rd Unit 34
- 48 Strathmore Rd Unit 33
- 48 Strathmore Rd Unit 32
- 48 Strathmore Rd Unit 31
- 48 Strathmore Rd Unit 27
- 48 Strathmore Rd Unit 26
- 48 Strathmore Rd Unit 25
- 48 Strathmore Rd Unit 24
- 48 Strathmore Rd Unit 23
- 48 Strathmore Rd Unit 22
- 48 Strathmore Rd Unit 21