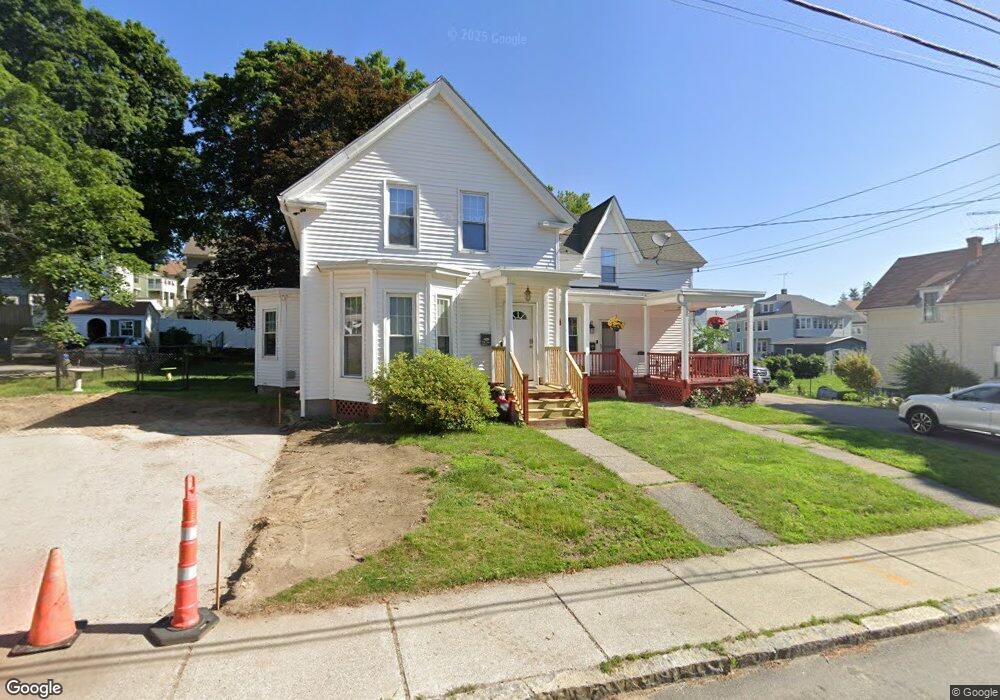
48 Summer St Nashua, NH 03064
North End Nashua NeighborhoodEstimated Value: $467,000 - $562,000
5
Beds
2
Baths
2,233
Sq Ft
$230/Sq Ft
Est. Value
About This Home
This home is located at 48 Summer St, Nashua, NH 03064 and is currently estimated at $513,277, approximately $229 per square foot. 48 Summer St is a home located in Hillsborough County with nearby schools including Mount Pleasant Elementary School, Pennichuck Middle School, and Nashua High School North.
Ownership History
Date
Name
Owned For
Owner Type
Purchase Details
Closed on
May 17, 2010
Sold by
Farmer Paul R and Farmer Doris J
Bought by
Marquis Kenneth and Zuniga Olga
Current Estimated Value
Home Financials for this Owner
Home Financials are based on the most recent Mortgage that was taken out on this home.
Original Mortgage
$251,611
Outstanding Balance
$169,140
Interest Rate
5.11%
Mortgage Type
Purchase Money Mortgage
Estimated Equity
$344,137
Purchase Details
Closed on
Nov 1, 2001
Sold by
Brown David H and Brown Jeanne S
Bought by
Gendron Michelle L and Gendron Gary H
Home Financials for this Owner
Home Financials are based on the most recent Mortgage that was taken out on this home.
Original Mortgage
$150,000
Interest Rate
6.82%
Mortgage Type
Purchase Money Mortgage
Purchase Details
Closed on
Oct 29, 1999
Sold by
Haddad William G and Haddad Victoria
Bought by
Farmer Paul R and Farmer Doris J
Create a Home Valuation Report for This Property
The Home Valuation Report is an in-depth analysis detailing your home's value as well as a comparison with similar homes in the area
Home Values in the Area
Average Home Value in this Area
Purchase History
| Date | Buyer | Sale Price | Title Company |
|---|---|---|---|
| Marquis Kenneth | $255,100 | -- | |
| Gendron Michelle L | $200,000 | -- | |
| Farmer Paul R | $142,000 | -- |
Source: Public Records
Mortgage History
| Date | Status | Borrower | Loan Amount |
|---|---|---|---|
| Open | Farmer Paul R | $251,611 | |
| Previous Owner | Farmer Paul R | $179,000 | |
| Previous Owner | Farmer Paul R | $95,000 | |
| Previous Owner | Farmer Paul R | $150,000 |
Source: Public Records
Tax History Compared to Growth
Tax History
| Year | Tax Paid | Tax Assessment Tax Assessment Total Assessment is a certain percentage of the fair market value that is determined by local assessors to be the total taxable value of land and additions on the property. | Land | Improvement |
|---|---|---|---|---|
| 2024 | $6,840 | $430,200 | $138,700 | $291,500 |
| 2023 | $6,636 | $364,000 | $110,900 | $253,100 |
| 2022 | $6,577 | $364,000 | $110,900 | $253,100 |
| 2021 | $5,450 | $234,700 | $73,900 | $160,800 |
| 2020 | $5,343 | $236,300 | $73,900 | $162,400 |
| 2019 | $5,142 | $236,300 | $73,900 | $162,400 |
| 2018 | $5,012 | $236,300 | $73,900 | $162,400 |
| 2017 | $5,829 | $226,000 | $83,700 | $142,300 |
| 2016 | $5,666 | $226,000 | $83,700 | $142,300 |
| 2015 | $5,544 | $226,000 | $83,700 | $142,300 |
| 2014 | $5,435 | $226,000 | $83,700 | $142,300 |
Source: Public Records
Map
Nearby Homes
- 19 Atherton Ave
- 15 Atherton Ave
- 13 Sapphire Ln
- 36-38 Courtland St
- 71 Concord St
- 21 Edson St
- 11 Charles St
- 4 Reservoir St
- 61 Manchester St
- 18 Harbor Ave Unit 208
- 73 Berkeley St
- 5 Mulberry St
- 19 Bartlett Ave
- 13 Mulvanity St
- 4 Chase St
- 31 Juliana Ave
- 31 Juliana Ave Unit 4
- 0 Baldwin St
- 3 Opal Way Unit 3
- 1 Opal Way Unit 1
- 46 Summer St
- 50 Summer St
- 47 Summer St
- 45 Summer St
- 9 Jefferson St Unit 11
- 7 Jefferson St
- 49 Summer St Unit 228
- 44 Summer St
- 3 Jefferson St
- 11 Jefferson St
- 51 Summer St
- 30 Salem St
- 29 Salem St
- 45 Cross St
- 13 Jefferson St Unit 15
- 52 Summer St Unit 54
- 52-54 Summer St
- 27 Salem St
- 41 Cross St Unit 411/2
- 41 Cross St Unit 4