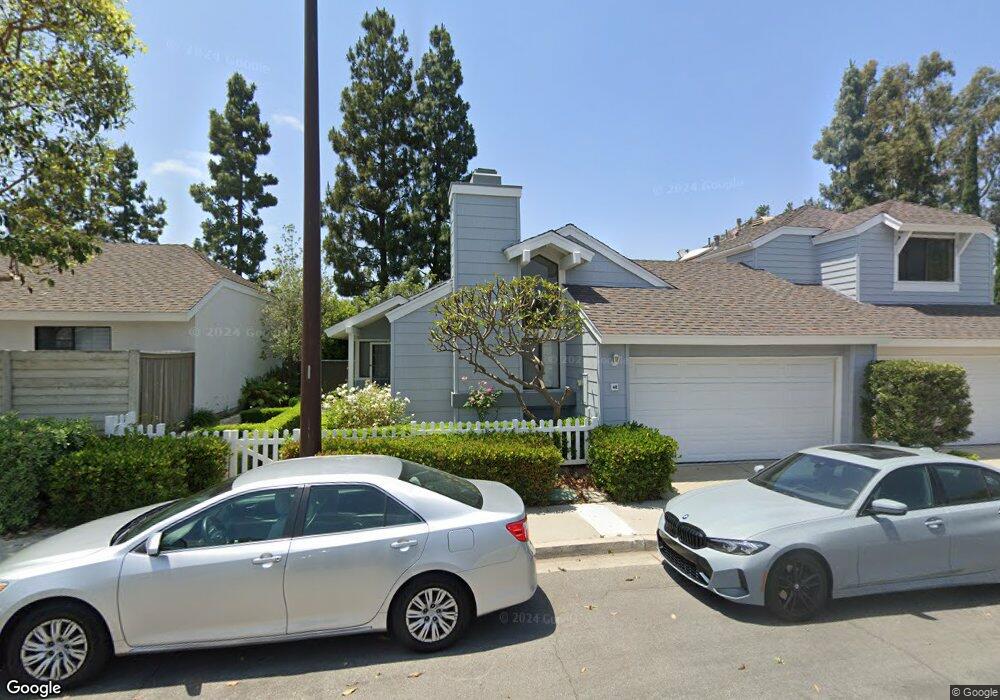
48 Summerfield Unit 24 Irvine, CA 92614
Woodbridge NeighborhoodEstimated Value: $969,000 - $1,121,000
3
Beds
2
Baths
1,144
Sq Ft
$894/Sq Ft
Est. Value
About This Home
This home is located at 48 Summerfield Unit 24, Irvine, CA 92614 and is currently estimated at $1,023,238, approximately $894 per square foot. 48 Summerfield Unit 24 is a home located in Orange County with nearby schools including Springbrook Elementary School, South Lake Middle School, and Woodbridge High School.
Ownership History
Date
Name
Owned For
Owner Type
Purchase Details
Closed on
Mar 13, 2007
Sold by
Katz Ronald L and Katz Teri
Bought by
Ronald L Katz M D Inc Profit Sharing Tr
Current Estimated Value
Purchase Details
Closed on
Sep 17, 2002
Sold by
Katz Ronald L and Katz Teri
Bought by
Katz Ronald Louis and Katz Teri
Home Financials for this Owner
Home Financials are based on the most recent Mortgage that was taken out on this home.
Original Mortgage
$182,750
Interest Rate
6.24%
Purchase Details
Closed on
May 9, 2001
Sold by
Katz Ronald L and Katz Teri
Bought by
Katz Ronald L and Katz Teri
Purchase Details
Closed on
Nov 16, 1999
Sold by
Aiylam Parameswaran S and Aiylam Uma
Bought by
Katz Ronald and Katz Teri
Home Financials for this Owner
Home Financials are based on the most recent Mortgage that was taken out on this home.
Original Mortgage
$185,000
Interest Rate
7.82%
Create a Home Valuation Report for This Property
The Home Valuation Report is an in-depth analysis detailing your home's value as well as a comparison with similar homes in the area
Home Values in the Area
Average Home Value in this Area
Purchase History
We collect this data history from publicly available records. To have your information removed, we recommend requesting removal directly through your county’s website.
| Date | Buyer | Sale Price | Title Company |
|---|---|---|---|
| Ronald L Katz M D Inc Profit Sharing Tr | $575,000 | None Available | |
| Katz Ronald Louis | -- | North American Title Co | |
| Katz Ronald L | -- | -- | |
| Katz Ronald | $245,000 | Chicago Title Co |
Source: Public Records
Mortgage History
We collect this data history from publicly available records. To have your information removed, we recommend requesting removal directly through your county’s website.
| Date | Status | Borrower | Loan Amount |
|---|---|---|---|
| Previous Owner | Katz Ronald Louis | $182,750 | |
| Previous Owner | Katz Ronald | $185,000 |
Source: Public Records
Tax History
| Year | Tax Paid | Tax Assessment Tax Assessment Total Assessment is a certain percentage of the fair market value that is determined by local assessors to be the total taxable value of land and additions on the property. | Land | Improvement |
|---|---|---|---|---|
| 2025 | $4,004 | $376,547 | $243,725 | $132,822 |
| 2024 | $4,004 | $369,164 | $238,946 | $130,218 |
| 2023 | $3,901 | $361,926 | $234,261 | $127,665 |
| 2022 | $3,831 | $354,830 | $229,668 | $125,162 |
| 2021 | $3,745 | $347,873 | $225,165 | $122,708 |
| 2020 | $3,723 | $344,306 | $222,856 | $121,450 |
| 2019 | $3,642 | $337,555 | $218,486 | $119,069 |
| 2018 | $3,575 | $330,937 | $214,202 | $116,735 |
| 2017 | $3,501 | $324,449 | $210,002 | $114,447 |
| 2016 | $3,348 | $318,088 | $205,885 | $112,203 |
| 2015 | $3,298 | $313,311 | $202,793 | $110,518 |
| 2014 | $3,234 | $307,174 | $198,820 | $108,354 |
Source: Public Records
Map
Nearby Homes
- 20 Wintermist Unit 86
- 30 Waterway Unit 43
- 492 E Yale Loop Unit 9
- 19 Waterway Unit 9
- 42 Almond Tree Ln
- 66 Emerald
- 17294 Citron
- 24 Greenmoor Unit 12
- 17284 Citron
- 1 Dogwood N
- 32 Spinnaker Unit 71
- 446 Fallingstar Unit 11
- 5 Carob
- 52 Greenbough Unit 98
- 336 Fallingstar Unit 45
- 3 Bayporte
- 2 Featherwood
- 41 Fallingstar Unit 28
- 54 Willow Tree Ln
- 53 Thicket Unit 38
- 53 Summerfield
- 51 Summerfield Unit 98
- 43 Summerfield Unit 92
- 43 Summerfield
- 55 Summerfield Unit 96
- 45 Summerfield Unit 91
- 22 Wintermist Unit 93
- 49 Summerfield Unit 99
- 59 Summerfield Unit 95
- 47 Summerfield Unit 90
- 47 Summerfield
- 24 Wintermist
- 50 Summerfield Unit 25
- 58 Summerfield Unit 29
- 41 Summerfield Unit 87
- 39 Summerfield Unit 88
- 20 Wintermist
- 52 Summerfield Unit 26
- 52 Summerfield
- 46 Summerfield Unit 23
Your Personal Tour Guide
Ask me questions while you tour the home.