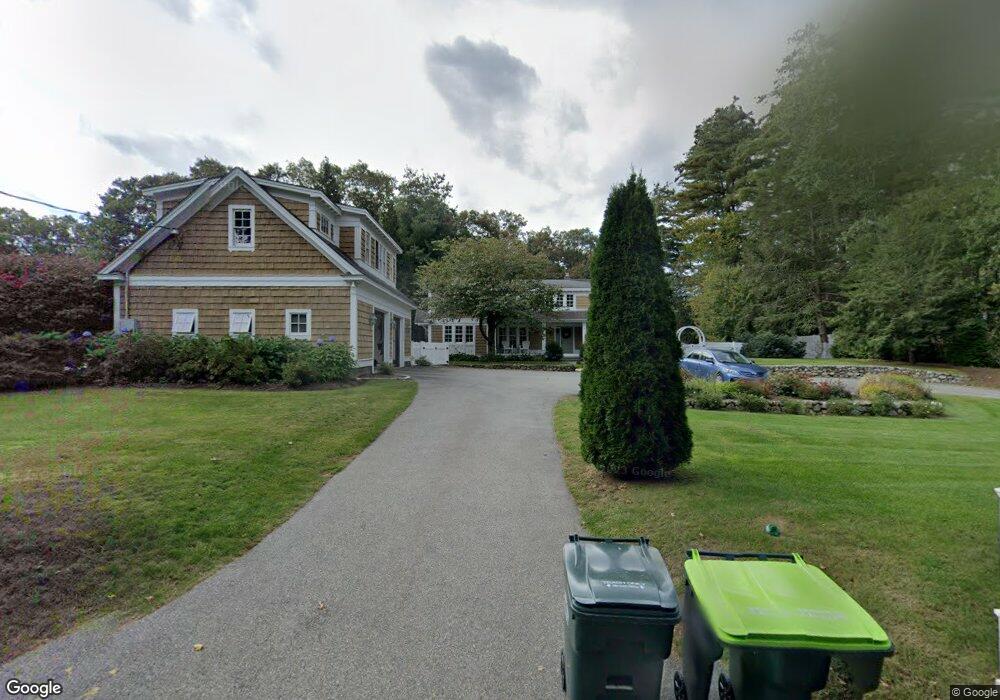
48 Sunset Rd Weston, MA 02493
Estimated Value: $2,141,000 - $2,510,000
5
Beds
4
Baths
4,105
Sq Ft
$573/Sq Ft
Est. Value
About This Home
This home is located at 48 Sunset Rd, Weston, MA 02493 and is currently estimated at $2,350,899, approximately $572 per square foot. 48 Sunset Rd is a home located in Middlesex County with nearby schools including Country Elementary School, Woodland Elementary School, and Field Elementary School.
Ownership History
Date
Name
Owned For
Owner Type
Purchase Details
Closed on
Feb 25, 2026
Sold by
Kachadurian Mary
Bought by
Smith Carla
Current Estimated Value
Purchase Details
Closed on
Jul 11, 2008
Sold by
Suominen Henry and Suominen Theresa M
Bought by
Kachadurian Mary
Purchase Details
Closed on
Jul 23, 1993
Sold by
Panasuk Robert
Bought by
Suominen Henry and Suominen Theresa M
Create a Home Valuation Report for This Property
The Home Valuation Report is an in-depth analysis detailing your home's value as well as a comparison with similar homes in the area
Home Values in the Area
Average Home Value in this Area
Purchase History
We collect this data history from publicly available records. To have your information removed, we recommend requesting removal directly through your county’s website.
| Date | Buyer | Sale Price | Title Company |
|---|---|---|---|
| Smith Carla | -- | -- | |
| Kachadurian Mary | $1,595,000 | -- | |
| Kachadurian Mary | $1,595,000 | -- | |
| Suominen Henry | $357,000 | -- |
Source: Public Records
Mortgage History
We collect this data history from publicly available records. To have your information removed, we recommend requesting removal directly through your county’s website.
| Date | Status | Borrower | Loan Amount |
|---|---|---|---|
| Previous Owner | Suominen Henry | $13,000 | |
| Previous Owner | Suominen Henry | $207,000 | |
| Previous Owner | Suominen Henry | $220,600 |
Source: Public Records
Tax History
| Year | Tax Paid | Tax Assessment Tax Assessment Total Assessment is a certain percentage of the fair market value that is determined by local assessors to be the total taxable value of land and additions on the property. | Land | Improvement |
|---|---|---|---|---|
| 2025 | $21,383 | $1,926,400 | $877,500 | $1,048,900 |
| 2024 | $20,940 | $1,883,100 | $877,500 | $1,005,600 |
| 2023 | $20,906 | $1,765,700 | $877,500 | $888,200 |
| 2022 | $20,082 | $1,567,700 | $835,000 | $732,700 |
| 2021 | $36,252 | $1,492,300 | $791,900 | $700,400 |
| 2020 | $5,498 | $1,454,000 | $791,900 | $662,100 |
| 2019 | $17,479 | $1,388,300 | $733,400 | $654,900 |
| 2018 | $17,368 | $1,388,300 | $733,400 | $654,900 |
| 2017 | $17,215 | $1,388,300 | $733,400 | $654,900 |
| 2016 | $16,876 | $1,387,800 | $733,400 | $654,400 |
| 2015 | $16,397 | $1,335,300 | $698,400 | $636,900 |
Source: Public Records
Map
Nearby Homes
- 50 Laurel Rd
- 183 Conant Rd
- 14 October Ln
- 3 Viles St
- 21 Bemis St
- 19 Old Rd
- 27 Silver Hill Rd
- 20 Old Rd
- 39 Church St
- 448 & 454 Concord Rd
- 10 Hitching Post Ln
- 39 Kings Grant Rd
- 15 Myles Standish Rd
- 678 Boston Post Rd
- 6 Clifford Ln
- 37 School St
- 416 Conant Rd
- 17 Wellesley St
- 23 Stony Brook Rd
- 40 Hobbs Brook Rd
Your Personal Tour Guide
Ask me questions while you tour the home.