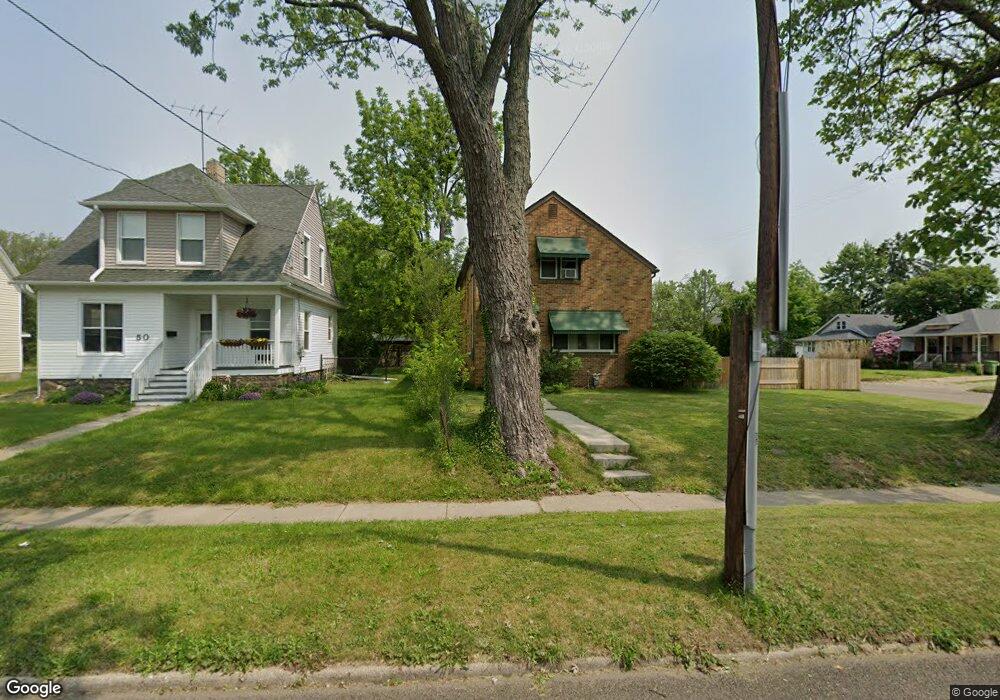
48 Territorial Rd W Battle Creek, MI 49015
Central Battle Creek NeighborhoodEstimated Value: $104,463 - $169,000
4
Beds
2
Baths
1,347
Sq Ft
$96/Sq Ft
Est. Value
About This Home
This home is located at 48 Territorial Rd W, Battle Creek, MI 49015 and is currently estimated at $129,616, approximately $96 per square foot. 48 Territorial Rd W is a home located in Calhoun County with nearby schools including Ann J. Kellogg School, Springfield Middle School, and Battle Creek Central High School.
Ownership History
Date
Name
Owned For
Owner Type
Purchase Details
Closed on
Apr 9, 2009
Sold by
Good Stewards Inc
Bought by
Hurley Jeffrey and Hurley Erin
Current Estimated Value
Home Financials for this Owner
Home Financials are based on the most recent Mortgage that was taken out on this home.
Original Mortgage
$70,695
Outstanding Balance
$45,287
Interest Rate
5.19%
Mortgage Type
FHA
Estimated Equity
$84,329
Purchase Details
Closed on
Aug 4, 2008
Sold by
Lisko Elizabeth
Bought by
Smith Victor V
Purchase Details
Closed on
Jul 20, 2007
Sold by
Kruller Jacob and Kruller Tryntje
Bought by
Smith Victor V and Lisko Elizabeth J
Purchase Details
Closed on
Sep 21, 2004
Sold by
Artz Jerry M and Artz Emery C
Bought by
Kruller Jacob and Kruller Tryntje
Home Financials for this Owner
Home Financials are based on the most recent Mortgage that was taken out on this home.
Original Mortgage
$75,905
Interest Rate
5.91%
Mortgage Type
Purchase Money Mortgage
Purchase Details
Closed on
Apr 18, 1996
Sold by
Artz Janice Clawson and Artz Emery C
Bought by
Artz Emery C and Artz Jerry M
Create a Home Valuation Report for This Property
The Home Valuation Report is an in-depth analysis detailing your home's value as well as a comparison with similar homes in the area
Home Values in the Area
Average Home Value in this Area
Purchase History
| Date | Buyer | Sale Price | Title Company |
|---|---|---|---|
| Hurley Jeffrey | $72,000 | Metropolitan Title Company | |
| Smith Victor V | -- | None Available | |
| Smith Victor V | $89,900 | Fatic | |
| Kruller Jacob | $79,900 | Chicago Title | |
| Artz Emery C | -- | -- |
Source: Public Records
Mortgage History
| Date | Status | Borrower | Loan Amount |
|---|---|---|---|
| Open | Hurley Jeffrey | $70,695 | |
| Previous Owner | Kruller Jacob | $75,905 |
Source: Public Records
Tax History Compared to Growth
Tax History
| Year | Tax Paid | Tax Assessment Tax Assessment Total Assessment is a certain percentage of the fair market value that is determined by local assessors to be the total taxable value of land and additions on the property. | Land | Improvement |
|---|---|---|---|---|
| 2025 | -- | $39,900 | $0 | $0 |
| 2024 | $1,040 | $33,231 | $0 | $0 |
| 2023 | $1,188 | $31,614 | $0 | $0 |
| 2022 | $939 | $25,625 | $0 | $0 |
| 2021 | $1,121 | $23,997 | $0 | $0 |
| 2020 | $1,125 | $23,999 | $0 | $0 |
| 2019 | $1,134 | $29,158 | $0 | $0 |
| 2018 | $1,134 | $28,750 | $958 | $27,792 |
| 2017 | $1,177 | $23,992 | $0 | $0 |
| 2016 | $1,194 | $27,169 | $0 | $0 |
| 2015 | $1,169 | $26,578 | $2,620 | $23,958 |
| 2014 | $1,169 | $25,378 | $2,620 | $22,758 |
Source: Public Records
Map
Nearby Homes
- 127 W Territorial Rd
- 235 Fairfield Ave
- 137 Fairfield Ave
- 41 Randolph St
- 32 Territorial Rd E
- 296 Meachem Ave
- 100 Eldred St
- 1 Grand Blvd
- 35 Eldred St
- 247 Iroquois Ave
- 71 Burnham St W
- 184 Territorial Rd W
- 236 Burnham St W
- 15 Marine Dr
- 348 Lakeview Ave
- 547 Wentworth Ave
- 57 Boulder St
- 171 Goguac St W
- 225 Columbia Ave W Unit 2
- 251 Columbia Ave W Unit 1
- 50 Territorial Rd W
- 84 Highland Ave
- 56 Territorial Rd W
- 87 Highland Ave
- 38 Territorial Rd W
- 78 Highland Ave
- 217 Territorial Rd W
- 85 Highland Ave
- 205 W Territorial Rd
- 64 Territorial Rd W
- 34 Territorial Rd W
- 37 Summer St
- 55 Summer St
- 57 Summer St
- 28 Territorial Rd W
- 68 Territorial Rd W
- 33 Summer St
- 223 Territorial Rd W
- 26 Territorial Rd W
- 70 Territorial Rd W