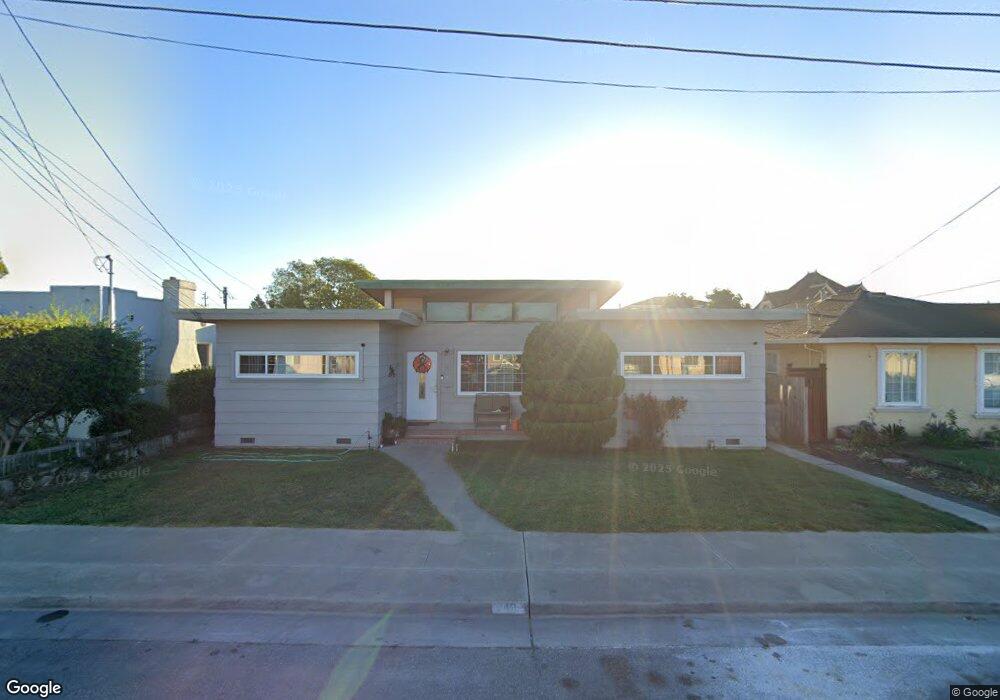
48 Tharp Ave Watsonville, CA 95076
Estimated Value: $296,000 - $830,000
3
Beds
2
Baths
1,374
Sq Ft
$489/Sq Ft
Est. Value
About This Home
This home is located at 48 Tharp Ave, Watsonville, CA 95076 and is currently estimated at $671,373, approximately $488 per square foot. 48 Tharp Ave is a home located in Santa Cruz County with nearby schools including Mintie White Elementary School, E.A. Hall Middle School, and Watsonville High School.
Ownership History
Date
Name
Owned For
Owner Type
Purchase Details
Closed on
Jul 17, 2020
Sold by
Leal Henry and Leal Maria C
Bought by
Leal Henry and Leal Maria
Current Estimated Value
Purchase Details
Closed on
Feb 20, 2020
Sold by
Leal Henry and Leal Maria C
Bought by
Leal Henry and Leal Maria C
Purchase Details
Closed on
Oct 14, 2011
Sold by
Wells Fargo Bank Na
Bought by
Leal Henry and Leal Maria C
Home Financials for this Owner
Home Financials are based on the most recent Mortgage that was taken out on this home.
Original Mortgage
$292,395
Interest Rate
4.4%
Mortgage Type
FHA
Purchase Details
Closed on
Sep 22, 2010
Sold by
Gonzalez Amalia Avila
Bought by
Wells Fargo Bank Na and Wachovia Mortgage
Purchase Details
Closed on
Jun 21, 2002
Sold by
Gonzalez Sergio C
Bought by
Gonzalez Amalia Avila
Home Financials for this Owner
Home Financials are based on the most recent Mortgage that was taken out on this home.
Original Mortgage
$300,000
Interest Rate
6.86%
Create a Home Valuation Report for This Property
The Home Valuation Report is an in-depth analysis detailing your home's value as well as a comparison with similar homes in the area
Home Values in the Area
Average Home Value in this Area
Purchase History
| Date | Buyer | Sale Price | Title Company |
|---|---|---|---|
| Leal Henry | -- | None Available | |
| Leal Henry | $100,000 | First American Title Company | |
| Leal Henry | $300,000 | Chicago Title Company | |
| Wells Fargo Bank Na | $244,553 | Accommodation | |
| Gonzalez Amalia Avila | -- | Santa Cruz Title Company |
Source: Public Records
Mortgage History
| Date | Status | Borrower | Loan Amount |
|---|---|---|---|
| Previous Owner | Leal Henry | $292,395 | |
| Previous Owner | Gonzalez Amalia Avila | $300,000 |
Source: Public Records
Tax History Compared to Growth
Tax History
| Year | Tax Paid | Tax Assessment Tax Assessment Total Assessment is a certain percentage of the fair market value that is determined by local assessors to be the total taxable value of land and additions on the property. | Land | Improvement |
|---|---|---|---|---|
| 2025 | $4,402 | $376,818 | $226,091 | $150,727 |
| 2023 | $4,335 | $362,187 | $217,312 | $144,875 |
| 2022 | $4,259 | $355,084 | $213,051 | $142,033 |
| 2021 | $4,188 | $348,120 | $208,872 | $139,248 |
| 2020 | $4,129 | $344,552 | $206,731 | $137,821 |
| 2019 | $4,056 | $337,795 | $202,677 | $135,118 |
| 2018 | $3,954 | $331,172 | $198,703 | $132,469 |
| 2017 | $3,921 | $324,681 | $194,808 | $129,873 |
| 2016 | $3,819 | $318,314 | $190,988 | $127,326 |
| 2015 | $3,806 | $313,532 | $188,119 | $125,413 |
| 2014 | $3,725 | $307,390 | $184,434 | $122,956 |
Source: Public Records
Map
Nearby Homes
- 630 California St
- 145 Alma St
- 708 Hill Ave
- 441 Center St
- 514 Argos Cir
- 563 Argos Cir
- 401 Spruce Cir
- 254 Rogers Ave
- 67 Roosevelt St
- 486 Cloudview Dr
- 202 Stanford St
- 932 Lincoln St
- 624 Delta Way
- 443 Tuttle Ave
- 229 Bronson St
- 443 Vivienne Dr
- 234 Maple Ave
- 30 Riverside Rd
- 759 Bronte Ave
- 176 Crestview Ct