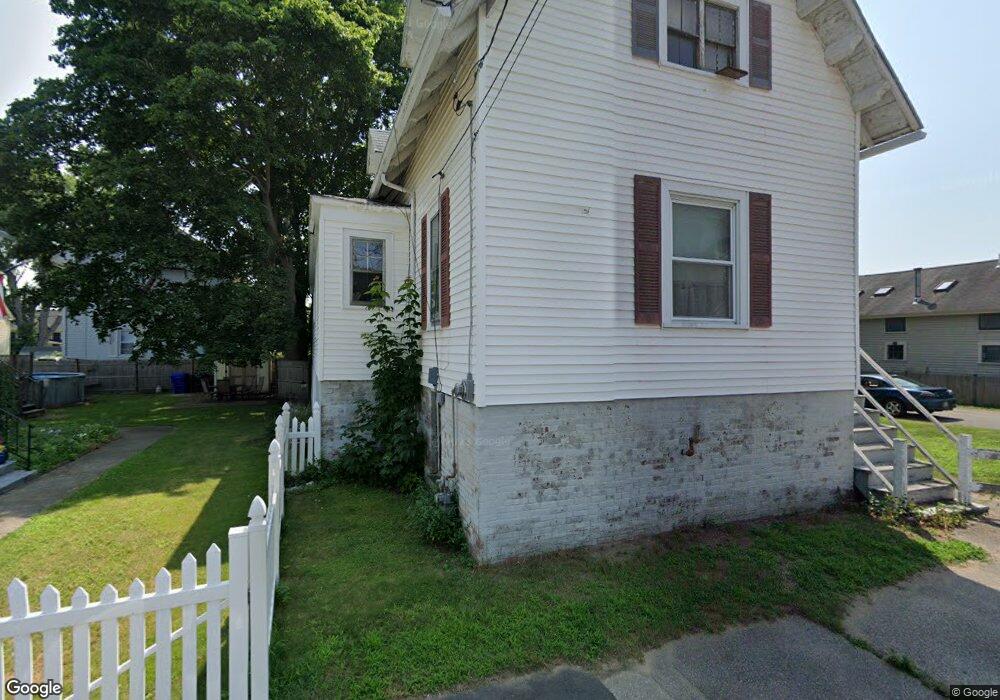
48 Union St Warren, RI 02885
Downtown Warren NeighborhoodEstimated Value: $417,665 - $517,000
3
Beds
1
Bath
1,476
Sq Ft
$323/Sq Ft
Est. Value
About This Home
This home is located at 48 Union St, Warren, RI 02885 and is currently estimated at $477,166, approximately $323 per square foot. 48 Union St is a home located in Bristol County with nearby schools including Mt. Hope High School, Highlander Charter Middle and High School, and East Bay Career Academy.
Ownership History
Date
Name
Owned For
Owner Type
Purchase Details
Closed on
Aug 8, 2025
Sold by
Saint George Stephanie
Bought by
Lily Of The Valley Llc
Current Estimated Value
Purchase Details
Closed on
Jun 18, 2025
Sold by
Warren Town Of
Bought by
E T Investments Llc
Purchase Details
Closed on
Apr 14, 2021
Sold by
Charlotte M Pacheco Ret and Pacheco
Bought by
Pacheco William J
Purchase Details
Closed on
Dec 22, 2015
Sold by
Pacheco Charlotte M
Bought by
Pacheco Charlotte M
Create a Home Valuation Report for This Property
The Home Valuation Report is an in-depth analysis detailing your home's value as well as a comparison with similar homes in the area
Home Values in the Area
Average Home Value in this Area
Purchase History
| Date | Buyer | Sale Price | Title Company |
|---|---|---|---|
| Lily Of The Valley Llc | -- | -- | |
| E T Investments Llc | $5,099 | None Available | |
| E T Investments Llc | $5,099 | None Available | |
| Pacheco William J | -- | None Available | |
| Pacheco William J | -- | None Available | |
| Pacheco Charlotte M | -- | -- | |
| Pacheco Charlotte M | -- | -- |
Source: Public Records
Tax History Compared to Growth
Tax History
| Year | Tax Paid | Tax Assessment Tax Assessment Total Assessment is a certain percentage of the fair market value that is determined by local assessors to be the total taxable value of land and additions on the property. | Land | Improvement |
|---|---|---|---|---|
| 2025 | $4,343 | $291,700 | $102,600 | $189,100 |
| 2024 | $4,212 | $291,700 | $102,600 | $189,100 |
| 2023 | $3,985 | $291,700 | $102,600 | $189,100 |
| 2022 | $3,973 | $220,600 | $94,900 | $125,700 |
| 2021 | $3,909 | $220,600 | $94,900 | $125,700 |
| 2020 | $3,830 | $220,600 | $94,900 | $125,700 |
| 2019 | $3,358 | $175,700 | $60,500 | $115,200 |
| 2018 | $3,314 | $175,700 | $60,500 | $115,200 |
| 2017 | $3,305 | $175,700 | $60,500 | $115,200 |
| 2016 | $3,583 | $179,400 | $78,600 | $100,800 |
| 2015 | $3,583 | $179,400 | $78,600 | $100,800 |
| 2014 | $3,601 | $179,400 | $78,600 | $100,800 |
Source: Public Records
Map
Nearby Homes