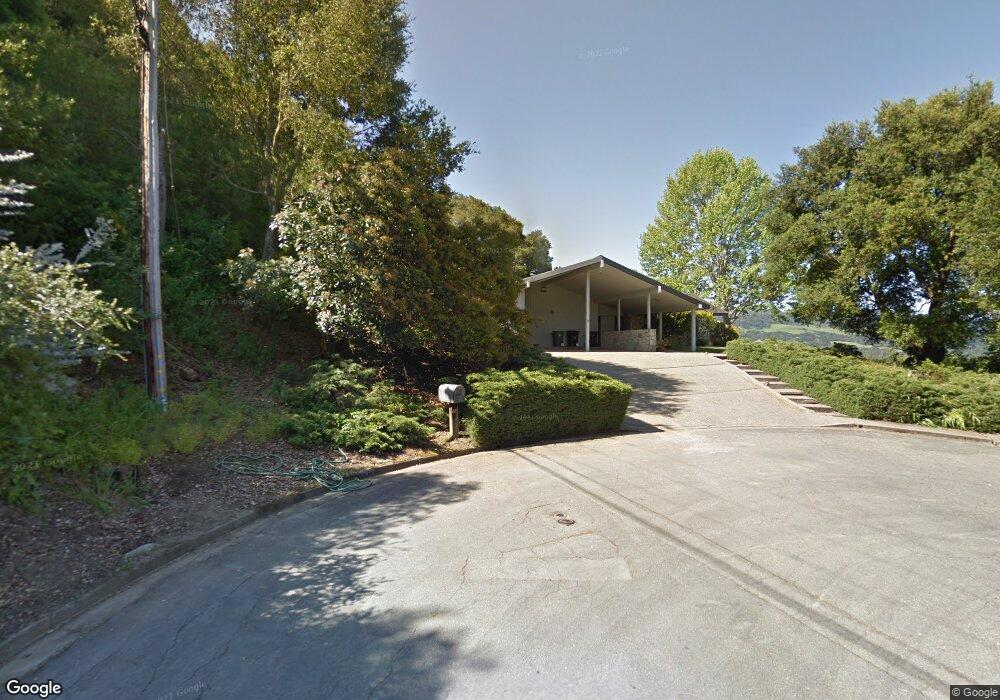
48 Valley View Rd Orinda, CA 94563
Sleepy Hollow-Orinda NeighborhoodEstimated Value: $3,407,000 - $5,528,000
4
Beds
5
Baths
4,748
Sq Ft
$878/Sq Ft
Est. Value
About This Home
This home is located at 48 Valley View Rd, Orinda, CA 94563 and is currently estimated at $4,171,025, approximately $878 per square foot. 48 Valley View Rd is a home located in Contra Costa County with nearby schools including Sleepy Hollow Elementary School, Orinda Intermediate School, and Miramonte High School.
Ownership History
Date
Name
Owned For
Owner Type
Purchase Details
Closed on
May 22, 2017
Sold by
Woodin William H and Woodin Ann O
Bought by
Swan Samuel C and Swan Jennifer S
Current Estimated Value
Home Financials for this Owner
Home Financials are based on the most recent Mortgage that was taken out on this home.
Original Mortgage
$4,125,000
Outstanding Balance
$3,455,542
Interest Rate
4.37%
Mortgage Type
Adjustable Rate Mortgage/ARM
Estimated Equity
$715,483
Purchase Details
Closed on
Oct 30, 2013
Sold by
Woodin W Hugh and Woodin Ann Orel
Bought by
Woodin William H and Woodin Ann O
Home Financials for this Owner
Home Financials are based on the most recent Mortgage that was taken out on this home.
Original Mortgage
$681,000
Interest Rate
3%
Mortgage Type
Adjustable Rate Mortgage/ARM
Create a Home Valuation Report for This Property
The Home Valuation Report is an in-depth analysis detailing your home's value as well as a comparison with similar homes in the area
Home Values in the Area
Average Home Value in this Area
Purchase History
| Date | Buyer | Sale Price | Title Company |
|---|---|---|---|
| Swan Samuel C | $2,600,000 | First American Title Company | |
| Woodin William H | -- | Fidelity National Title Co |
Source: Public Records
Mortgage History
| Date | Status | Borrower | Loan Amount |
|---|---|---|---|
| Open | Swan Samuel C | $4,125,000 | |
| Previous Owner | Woodin William H | $681,000 |
Source: Public Records
Tax History
| Year | Tax Paid | Tax Assessment Tax Assessment Total Assessment is a certain percentage of the fair market value that is determined by local assessors to be the total taxable value of land and additions on the property. | Land | Improvement |
|---|---|---|---|---|
| 2025 | $41,622 | $3,472,512 | $2,089,052 | $1,383,460 |
| 2024 | $40,283 | $3,404,425 | $2,048,091 | $1,356,334 |
| 2023 | $40,283 | $3,337,673 | $2,007,933 | $1,329,740 |
| 2022 | $39,502 | $3,272,229 | $1,968,562 | $1,303,667 |
| 2021 | $38,709 | $3,208,068 | $1,929,963 | $1,278,105 |
| 2019 | $23,537 | $1,872,720 | $1,872,720 | $0 |
| 2018 | $30,780 | $2,652,000 | $1,836,000 | $816,000 |
| 2017 | $15,293 | $1,254,055 | $565,896 | $688,159 |
| 2016 | $14,924 | $1,229,466 | $554,800 | $674,666 |
| 2015 | $14,773 | $1,210,999 | $546,467 | $664,532 |
| 2014 | $14,567 | $1,187,278 | $535,763 | $651,515 |
Source: Public Records
Map
Nearby Homes
- 15 Los Dedos Rd
- 8 Oak Arbor Rd
- 22 Irving Ln
- 13 Saint James Ct
- 39 Saint Stephens Dr
- 475 Dalewood Dr
- 2 Crane Ct
- 7 Saint Stephens Dr
- 38 Vista Del Mar
- 9 Charles Hill Rd
- 319 Tappan Terrace
- 128 Diablo View Dr
- 147 Amber Valley Dr
- 221 Canon Dr
- 4500 Canyon Rd
- 0 Canon Dr Unit 41122231
- 0 Canon Dr Unit 225135758
- 0 Crescent Dr
- 11 Los Conejos
- 4146 Canyon Rd
Your Personal Tour Guide
Ask me questions while you tour the home.