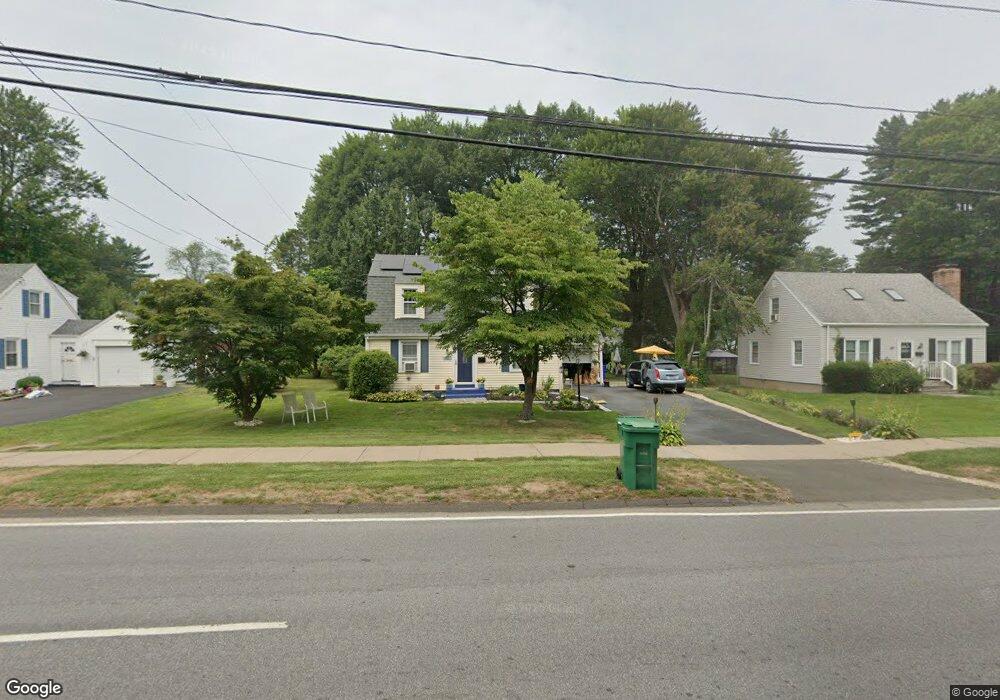
48 Wintonbury Ave Bloomfield, CT 06002
Estimated Value: $340,929 - $382,000
2
Beds
2
Baths
1,400
Sq Ft
$255/Sq Ft
Est. Value
About This Home
This home is located at 48 Wintonbury Ave, Bloomfield, CT 06002 and is currently estimated at $357,232, approximately $255 per square foot. 48 Wintonbury Ave is a home located in Hartford County with nearby schools including Laurel School, Carmen Arace Intermediate School, and Metacomet School.
Ownership History
Date
Name
Owned For
Owner Type
Purchase Details
Closed on
Jun 8, 2021
Sold by
Towns Alvin
Bought by
Towns Alvin and Towins Geraldine
Current Estimated Value
Purchase Details
Closed on
Mar 23, 2015
Sold by
Redekas Properties Llc
Bought by
Towns Alvin
Home Financials for this Owner
Home Financials are based on the most recent Mortgage that was taken out on this home.
Original Mortgage
$179,742
Interest Rate
3.6%
Mortgage Type
New Conventional
Purchase Details
Closed on
Nov 17, 2014
Sold by
Fnma
Bought by
Redekas Properties Llc
Purchase Details
Closed on
Aug 20, 2014
Sold by
Jp Morgan Chase Bank N
Bought by
Federal National Mortgage Association
Purchase Details
Closed on
Aug 31, 1992
Sold by
Pattison Ethel
Bought by
Degregorio Thomas and Hamlin Tae
Create a Home Valuation Report for This Property
The Home Valuation Report is an in-depth analysis detailing your home's value as well as a comparison with similar homes in the area
Home Values in the Area
Average Home Value in this Area
Purchase History
| Date | Buyer | Sale Price | Title Company |
|---|---|---|---|
| Towns Alvin | -- | None Available | |
| Towns Alvin | -- | None Available | |
| Towns Alvin | $174,000 | -- | |
| Towns Alvin | $174,000 | -- | |
| Redekas Properties Llc | $84,500 | -- | |
| Redekas Properties Llc | $84,500 | -- | |
| Federal National Mortgage Association | -- | -- | |
| Jp Morgan Chase Bank N | $88,706 | -- | |
| Jp Morgan Chase Bank N | $88,706 | -- | |
| Degregorio Thomas | $100,000 | -- | |
| Degregorio Thomas | $100,000 | -- |
Source: Public Records
Mortgage History
| Date | Status | Borrower | Loan Amount |
|---|---|---|---|
| Previous Owner | Degregorio Thomas | $179,622 | |
| Previous Owner | Degregorio Thomas | $179,742 |
Source: Public Records
Tax History Compared to Growth
Tax History
| Year | Tax Paid | Tax Assessment Tax Assessment Total Assessment is a certain percentage of the fair market value that is determined by local assessors to be the total taxable value of land and additions on the property. | Land | Improvement |
|---|---|---|---|---|
| 2025 | $6,284 | $167,580 | $38,920 | $128,660 |
| 2024 | $4,671 | $119,040 | $34,200 | $84,840 |
| 2023 | $4,587 | $119,040 | $34,200 | $84,840 |
| 2022 | $4,264 | $118,340 | $33,500 | $84,840 |
| 2021 | $4,358 | $118,340 | $33,500 | $84,840 |
| 2020 | $4,291 | $118,340 | $33,500 | $84,840 |
| 2019 | $4,575 | $118,340 | $33,500 | $84,840 |
| 2018 | $4,166 | $107,870 | $33,250 | $74,620 |
| 2017 | $4,159 | $107,870 | $33,250 | $74,620 |
| 2016 | $4,061 | $107,870 | $33,250 | $74,620 |
| 2015 | $3,986 | $107,870 | $33,250 | $74,620 |
| 2014 | $4,493 | $125,720 | $45,010 | $80,710 |
Source: Public Records
Map
Nearby Homes
- 11 Woodland Ave Unit E
- 70 Tunxis Ave
- 79 Prospect St
- 23 Hawthorne Ln Unit 23
- 28 Carpenter Ln
- 2 Lee Cir
- 108 Woodland Ave
- 40 Mountain Ave
- 86 Gabb Rd
- 18 Nolan Dr
- 12 Filley St
- 14 Filley St
- 4 Skinner Dr
- 25 Filley St
- 12 Garrison Terrace
- 76 Silo Way Unit 76
- 6 Wild Rose Ct Unit 6
- 9 Mallard Dr
- 208 Castlewood Dr Unit 208
- 256 Park Ave
- 50 Wintonbury Ave
- 8 Applewood Rd
- 51 Wintonbury Ave
- 44 Wintonbury Ave
- 54 Wintonbury Ave
- 4 Woodland Ave
- 6 Woodland Ave
- 46 Wintonbury Ave
- 10 Applewood Rd
- 56 Wintonbury Ave
- 7 Applewood Rd
- 0 Woodland Ave
- 5 Woodland Ave
- 7 Woodland Ave Unit H
- 7 Woodland Ave Unit A
- 7 Woodland Ave Unit G
- 7 Woodland Ave Unit F
- 7 Woodland Ave Unit D
- 7 Woodland Ave Unit C
- 7 Woodland Ave Unit B