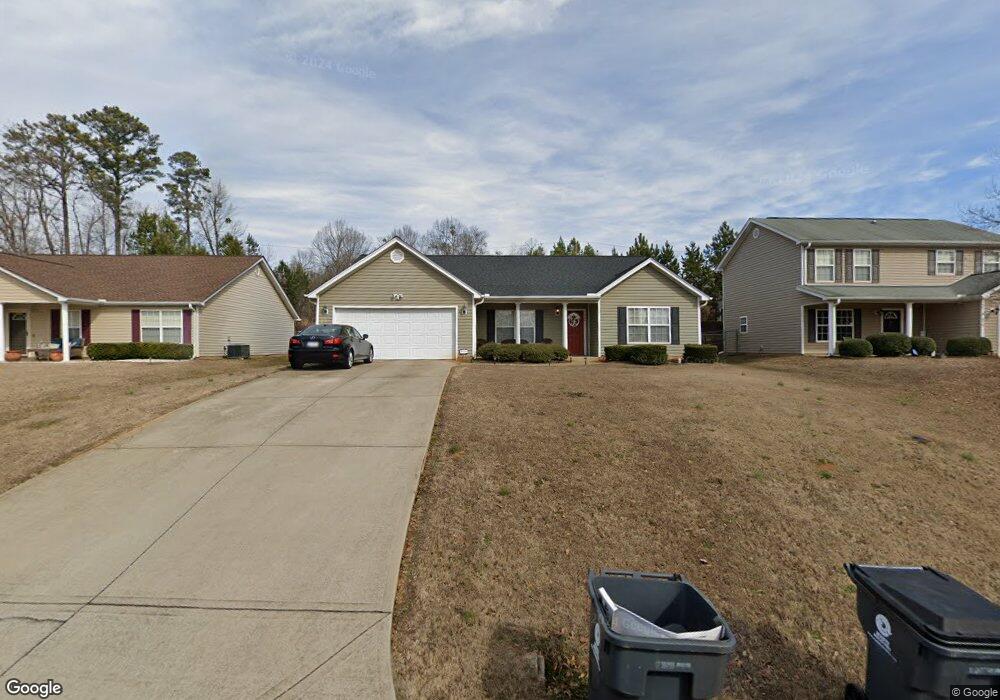
480 Barton St Duncan, SC 29334
Estimated Value: $257,000 - $303,000
3
Beds
2
Baths
1,875
Sq Ft
$147/Sq Ft
Est. Value
About This Home
This home is located at 480 Barton St, Duncan, SC 29334 and is currently estimated at $274,984, approximately $146 per square foot. 480 Barton St is a home located in Spartanburg County with nearby schools including Duncan Elementary School, Byrnes Freshman Academy, and Beech Springs Intermediate School.
Ownership History
Date
Name
Owned For
Owner Type
Purchase Details
Closed on
Dec 5, 2011
Sold by
Cox T Louis
Bought by
Cowen Calvin A
Current Estimated Value
Purchase Details
Closed on
Oct 19, 2009
Sold by
Weizenecker Homes Inc
Bought by
Foster Terikka Necole
Home Financials for this Owner
Home Financials are based on the most recent Mortgage that was taken out on this home.
Original Mortgage
$104,825
Interest Rate
5.04%
Mortgage Type
Future Advance Clause Open End Mortgage
Purchase Details
Closed on
Aug 25, 2009
Sold by
Regions Bank
Bought by
Weizenecker Homes Inc
Home Financials for this Owner
Home Financials are based on the most recent Mortgage that was taken out on this home.
Original Mortgage
$104,825
Interest Rate
5.04%
Mortgage Type
Future Advance Clause Open End Mortgage
Purchase Details
Closed on
Apr 9, 2009
Sold by
Martin Henry Investments Inc
Bought by
Regions Bank
Purchase Details
Closed on
Mar 15, 2006
Sold by
Newman Lyda S
Bought by
Padgett Edward L
Create a Home Valuation Report for This Property
The Home Valuation Report is an in-depth analysis detailing your home's value as well as a comparison with similar homes in the area
Home Values in the Area
Average Home Value in this Area
Purchase History
| Date | Buyer | Sale Price | Title Company |
|---|---|---|---|
| Cowen Calvin A | -- | -- | |
| Foster Terikka Necole | $102,770 | -- | |
| Weizenecker Homes Inc | $55,000 | -- | |
| Regions Bank | $277,602 | -- | |
| Padgett Edward L | $80,000 | None Available |
Source: Public Records
Mortgage History
| Date | Status | Borrower | Loan Amount |
|---|---|---|---|
| Previous Owner | Foster Terikka Necole | $104,825 |
Source: Public Records
Tax History
| Year | Tax Paid | Tax Assessment Tax Assessment Total Assessment is a certain percentage of the fair market value that is determined by local assessors to be the total taxable value of land and additions on the property. | Land | Improvement |
|---|---|---|---|---|
| 2022 | $1,079 | $4,439 | $553 | $3,886 |
| 2021 | $1,059 | $4,439 | $553 | $3,886 |
| 2020 | $1,043 | $4,439 | $553 | $3,886 |
| 2019 | $1,034 | $4,439 | $553 | $3,886 |
| 2018 | $983 | $4,439 | $553 | $3,886 |
| 2017 | $884 | $3,860 | $600 | $3,260 |
| 2016 | $855 | $3,860 | $600 | $3,260 |
| 2015 | $838 | $3,860 | $600 | $3,260 |
| 2014 | $830 | $3,860 | $600 | $3,260 |
Source: Public Records
Map
Nearby Homes
- 101 Parker St
- 124 Lyman Ave
- 128 Lyman Ave
- 114 N Moore St
- 11 Campbell St
- 31 Campbell St
- 198 Spring St
- 123 Sunny Ray Dr
- 148 N Church St
- 113 North Ave
- 108 Piedmont St
- 101 Gap Creek Rd
- 170 Spartanburg Rd
- 290 Forest Lake Rd
- 296 Forest Lake Rd
- 0 S Danzler Rd Unit 7362340
- 22 Meadow St
- 100 Holly Dr
- 6 Crest St
- 101 Lawrence St
- 484 Barton St
- 135 S Church St
- 488 Barton St
- 490 Barton St
- 485 Barton St
- 475 Barton St
- 494 Barton St
- 133 S Church St
- 133 S Church St Extension
- 138 S Church St Extension
- 496 Barton St
- 495 Barton St
- 132 S Church St
- 498 Barton St
- 137 S Church St
- 144 S Church St Extension
- 144 S Church St Ext St
- 144 S Church St Extension
- 128 S Church St
- 154 S Church St Extension
Your Personal Tour Guide
Ask me questions while you tour the home.