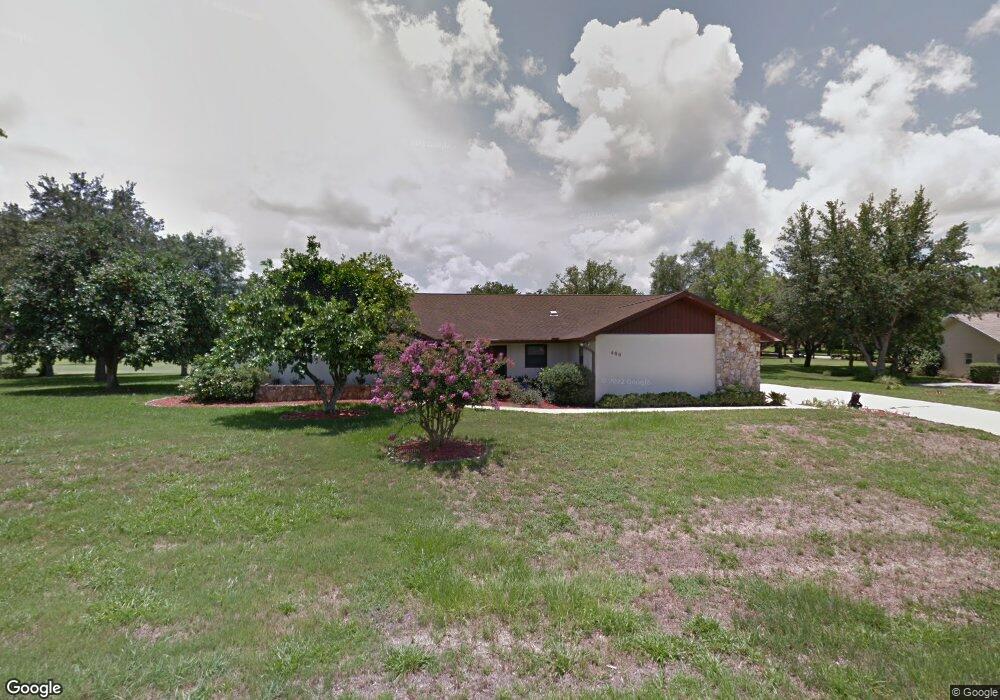
480 E Epsom Ct Hernando, FL 34442
Estimated Value: $322,102 - $394,000
3
Beds
2
Baths
1,754
Sq Ft
$205/Sq Ft
Est. Value
About This Home
This home is located at 480 E Epsom Ct, Hernando, FL 34442 and is currently estimated at $359,276, approximately $204 per square foot. 480 E Epsom Ct is a home located in Citrus County with nearby schools including Forest Ridge Elementary School, Lecanto Middle School, and Lecanto High School.
Ownership History
Date
Name
Owned For
Owner Type
Purchase Details
Closed on
Mar 10, 2022
Sold by
Sundberg Charles R and Sundberg Shirley A
Bought by
Sundberg Charles R and Sundb Shirley
Current Estimated Value
Purchase Details
Closed on
Mar 23, 2011
Sold by
Russo William Andrew and Russo Jason Edward
Bought by
Sundberg Charles R and Sundberg Shirley A
Home Financials for this Owner
Home Financials are based on the most recent Mortgage that was taken out on this home.
Original Mortgage
$88,000
Interest Rate
4.83%
Mortgage Type
New Conventional
Purchase Details
Closed on
Jan 1, 2011
Bought by
Sundberg Charles R and Sundberg Shirley A
Purchase Details
Closed on
Apr 1, 1990
Bought by
Sundberg Charles R and Sundberg Shirley A
Purchase Details
Closed on
Dec 1, 1983
Bought by
Sundberg Charles R and Sundberg Shirley A
Create a Home Valuation Report for This Property
The Home Valuation Report is an in-depth analysis detailing your home's value as well as a comparison with similar homes in the area
Home Values in the Area
Average Home Value in this Area
Purchase History
| Date | Buyer | Sale Price | Title Company |
|---|---|---|---|
| Sundberg Charles R | -- | None Listed On Document | |
| Sundberg Charles R | $110,000 | Attorney | |
| Sundberg Charles R | $100 | -- | |
| Sundberg Charles R | $132,000 | -- | |
| Sundberg Charles R | $21,700 | -- |
Source: Public Records
Mortgage History
| Date | Status | Borrower | Loan Amount |
|---|---|---|---|
| Previous Owner | Sundberg Charles R | $88,000 |
Source: Public Records
Tax History
| Year | Tax Paid | Tax Assessment Tax Assessment Total Assessment is a certain percentage of the fair market value that is determined by local assessors to be the total taxable value of land and additions on the property. | Land | Improvement |
|---|---|---|---|---|
| 2025 | $3,757 | $248,178 | $35,000 | $213,178 |
| 2024 | $3,573 | $252,719 | $33,500 | $219,219 |
| 2023 | $3,573 | $249,857 | $30,500 | $219,357 |
| 2022 | $3,139 | $223,707 | $29,000 | $194,707 |
| 2021 | $2,754 | $187,284 | $29,350 | $157,934 |
| 2020 | $2,450 | $161,409 | $30,000 | $131,409 |
| 2019 | $2,395 | $155,876 | $22,750 | $133,126 |
| 2018 | $2,224 | $144,043 | $25,050 | $118,993 |
| 2017 | $2,055 | $128,147 | $18,500 | $109,647 |
| 2016 | $1,999 | $119,737 | $16,280 | $103,457 |
| 2015 | $1,931 | $112,891 | $14,530 | $98,361 |
| 2014 | $2,104 | $119,260 | $17,508 | $101,752 |
Source: Public Records
Map
Nearby Homes
- 560 E Falconry Ct
- 738 E Epsom Ct
- 370 E Glassboro Ct
- 705 E Dakota Ct
- 650 E Charleston Ct
- 333 E Hartford St Unit 1B
- 837 E Epsom Ct
- 240 E Glassboro Ct Unit 4A
- 720 E Gilchrist Ct Unit 5A
- 186 E Glassboro Ct Unit 4B
- 230 E Boston St
- 261 E Hartford St Unit 1A
- 156 E Glassboro Ct Unit 5A
- 612 E Hartford St
- 700 E Boston St
- 640 E Hartford St
- 226 E Hartford St
- 175 E Hartford St Unit 5A
- 771 E Hartford St
- 451 E Ireland Ct
- 739 E Epsom Ct
- 520 E Epsom Ct
- 464 E Epsom Ct
- 479 E Epsom Ct
- 517 E Epsom Ct
- 463 E Epsom Ct
- 540 E Epsom Ct
- 410 E Eureka Ct
- 525 E Epsom Ct
- 489 E Falconry Ct
- 566 E Epsom Ct
- 461 E Falconry Ct
- 0 N Citrus Hills Blvd
- 515 E Falconry Ct
- 565 E Epsom Ct
- 390 E Eureka Ct
- 535 E Falconry Ct
- 0 E Eureka Ct
- 395 E Eureka Ct
- 409 E Eureka Ct
Your Personal Tour Guide
Ask me questions while you tour the home.