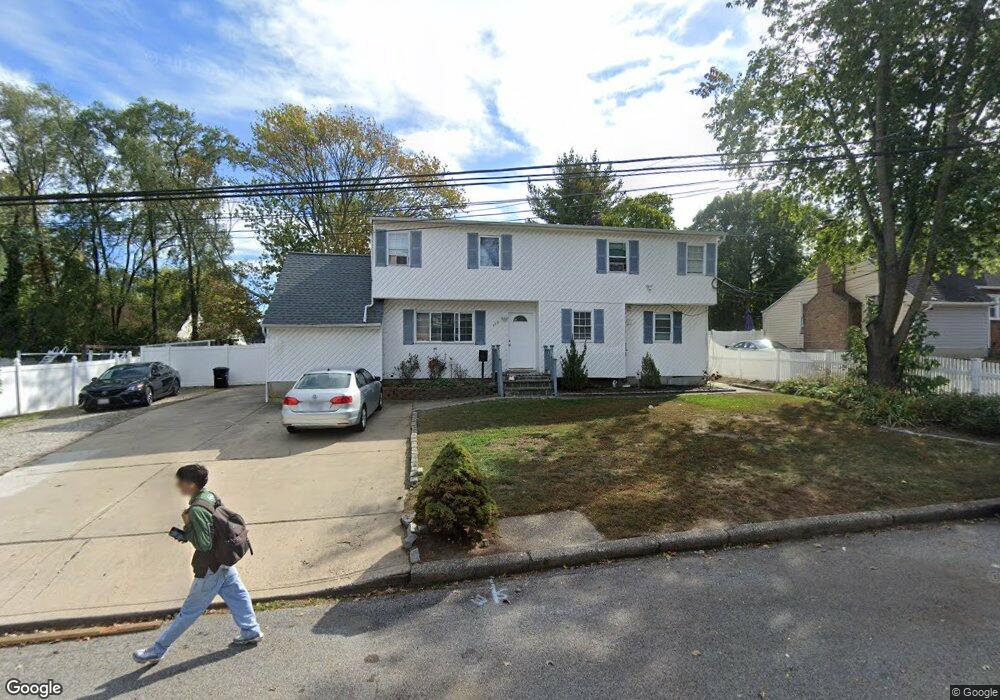
480 Saint Johns St Central Islip, NY 11722
Estimated Value: $573,800 - $640,000
6
Beds
4
Baths
2,250
Sq Ft
$265/Sq Ft
Est. Value
About This Home
This home is located at 480 Saint Johns St, Central Islip, NY 11722 and is currently estimated at $595,450, approximately $264 per square foot. 480 Saint Johns St is a home located in Suffolk County with nearby schools including Anthony Alfano Elementary School and Central Islip Senior High School.
Ownership History
Date
Name
Owned For
Owner Type
Purchase Details
Closed on
Jul 14, 2025
Sold by
Reyes Ever S
Bought by
Fuentes Maximino
Current Estimated Value
Purchase Details
Closed on
Mar 6, 2024
Sold by
Reyes Ever S and Diaz-Molina Lesli
Bought by
Reyes Ever S
Purchase Details
Closed on
Sep 25, 2023
Sold by
Reyes Ever S and Santos Carmen
Bought by
Reyes Ever S and Diaz-Molina Lesli
Purchase Details
Closed on
May 9, 2022
Sold by
Martinez Jennifer E and Santos Carmen
Bought by
Reyes Ever S and Santos Carmen
Purchase Details
Closed on
Mar 12, 2021
Sold by
Diaz-Molina Maria S
Bought by
Martinez Jennifer E and Santos Carmen
Home Financials for this Owner
Home Financials are based on the most recent Mortgage that was taken out on this home.
Original Mortgage
$299,653
Interest Rate
2.9%
Mortgage Type
FHA
Purchase Details
Closed on
Jun 3, 2011
Sold by
Machado Jose S Diaz and Molina Maria S
Bought by
Molina Maria S Diaz
Purchase Details
Closed on
May 19, 2010
Sold by
Salavarria Jose
Bought by
Diaz Machado Jose S and Diaz Molina Maria
Home Financials for this Owner
Home Financials are based on the most recent Mortgage that was taken out on this home.
Original Mortgage
$214,692
Interest Rate
4.4%
Mortgage Type
FHA
Purchase Details
Closed on
Sep 30, 2005
Sold by
Castella Nos Nelson O
Bought by
Salavarria Jose Luis
Purchase Details
Closed on
Oct 23, 2002
Sold by
Sanchez Victor
Bought by
Castellanos Nelson O
Home Financials for this Owner
Home Financials are based on the most recent Mortgage that was taken out on this home.
Original Mortgage
$194,500
Interest Rate
6.07%
Mortgage Type
Purchase Money Mortgage
Purchase Details
Closed on
Mar 8, 2002
Sold by
Our Savior Church Housing Inc
Bought by
Sanchez Victor
Home Financials for this Owner
Home Financials are based on the most recent Mortgage that was taken out on this home.
Original Mortgage
$150,689
Interest Rate
6.91%
Mortgage Type
Purchase Money Mortgage
Purchase Details
Closed on
Dec 14, 2001
Sold by
Hud and Federal Housing Commissioner
Bought by
Our Savior Church Housing Inc
Create a Home Valuation Report for This Property
The Home Valuation Report is an in-depth analysis detailing your home's value as well as a comparison with similar homes in the area
Home Values in the Area
Average Home Value in this Area
Purchase History
| Date | Buyer | Sale Price | Title Company |
|---|---|---|---|
| Fuentes Maximino | $575,000 | -- | |
| Reyes Ever S | -- | None Available | |
| Reyes Ever S | -- | None Available | |
| Reyes Ever S | -- | None Available | |
| Reyes Ever S | -- | None Available | |
| Reyes Ever S | -- | None Available | |
| Reyes Ever S | -- | None Available | |
| Martinez Jennifer E | $310,000 | None Available | |
| Martinez Jennifer E | $310,000 | None Available | |
| Molina Maria S Diaz | -- | -- | |
| Molina Maria S Diaz | -- | -- | |
| Diaz Machado Jose S | $220,000 | -- | |
| Diaz Machado Jose S | $220,000 | -- | |
| Salavarria Jose Luis | $410,000 | William Scheurer | |
| Salavarria Jose Luis | $410,000 | William Scheurer | |
| Castellanos Nelson O | $244,000 | Chicago Title Insurance Co | |
| Castellanos Nelson O | $244,000 | Chicago Title Insurance Co | |
| Sanchez Victor | $158,620 | Chicago Title | |
| Sanchez Victor | $158,620 | Chicago Title | |
| Our Savior Church Housing Inc | $87,500 | Chicago Title Insurance Co | |
| Our Savior Church Housing Inc | $87,500 | Chicago Title Insurance Co |
Source: Public Records
Mortgage History
| Date | Status | Borrower | Loan Amount |
|---|---|---|---|
| Previous Owner | Martinez Jennifer E | $299,653 | |
| Previous Owner | Diaz Machado Jose S | $214,692 | |
| Previous Owner | Castellanos Nelson O | $194,500 | |
| Previous Owner | Sanchez Victor | $150,689 |
Source: Public Records
Tax History Compared to Growth
Tax History
| Year | Tax Paid | Tax Assessment Tax Assessment Total Assessment is a certain percentage of the fair market value that is determined by local assessors to be the total taxable value of land and additions on the property. | Land | Improvement |
|---|---|---|---|---|
| 2024 | $13,807 | $43,100 | $4,300 | $38,800 |
| 2023 | $13,807 | $43,100 | $4,300 | $38,800 |
| 2022 | $10,471 | $43,100 | $4,300 | $38,800 |
| 2021 | $10,471 | $43,100 | $4,300 | $38,800 |
| 2020 | $13,437 | $43,100 | $4,300 | $38,800 |
| 2019 | $13,437 | $0 | $0 | $0 |
| 2018 | -- | $43,100 | $4,300 | $38,800 |
| 2017 | $13,140 | $43,100 | $4,300 | $38,800 |
| 2016 | $10,985 | $36,800 | $4,300 | $32,500 |
| 2015 | -- | $36,800 | $4,300 | $32,500 |
| 2014 | -- | $36,800 | $4,300 | $32,500 |
Source: Public Records
Map
Nearby Homes
- 385 Clayton St
- 24 3rd Ave
- 22 3rd Ave
- 475 Clift St
- 164 Ashley Ct
- 156 Ashley Ct
- 12 South Rd
- 330 Irving St
- 106 Northwood Blvd
- 74 E Suffolk Ave
- 13 Poplar St
- 245 Ackerman St
- 11 Northwood Blvd
- 14 E Walnut St
- 5 Northwood Blvd
- 132 Weatherby Ln Unit 132
- 37 Weatherby Ln
- 56 Fairlawn Dr
- 52 Fairlawn Dr
- 17 Hunter Dr
- 470 Saint Johns St
- 490 Saint Johns St
- 485 Clayton St
- 495 Clayton St
- 475 Clayton St
- 485 Saint Johns St
- 489 Saint Johns St
- 475 Saint Johns St
- 498 Saint Johns St
- 465 Clayton St
- 499 Clayton St
- 465 Saint Johns St
- 495 Saint Johns St
- 450 Saint Johns St
- 480 Clayton St
- 470 Clayton St
- 490 Clayton St
- 455 Saint Johns St
- 499 Saint Johns St