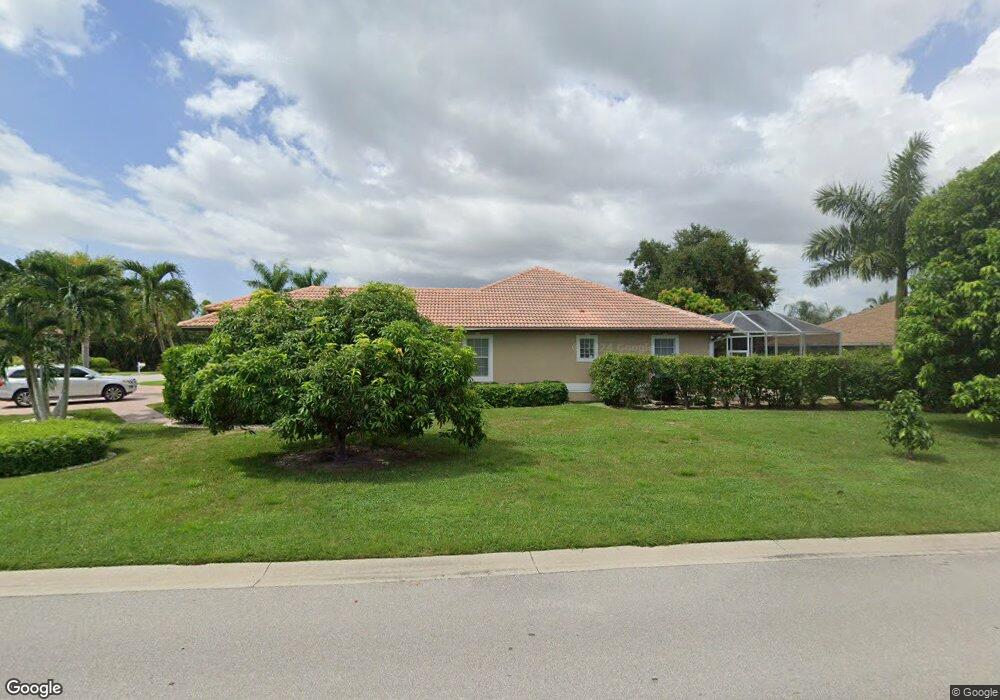
4800 Berkeley Dr Naples, FL 34112
East Naples NeighborhoodEstimated Value: $596,000 - $756,000
Studio
--
Bath
2,271
Sq Ft
$305/Sq Ft
Est. Value
About This Home
This home is located at 4800 Berkeley Dr, Naples, FL 34112 and is currently estimated at $691,708, approximately $304 per square foot. 4800 Berkeley Dr is a home located in Collier County with nearby schools including Lely Elementary School, East Naples Middle School, and Lely High School.
Ownership History
Date
Name
Owned For
Owner Type
Purchase Details
Closed on
Mar 18, 2024
Sold by
Deonareine Kelvin
Bought by
Solomon Fareeza
Current Estimated Value
Purchase Details
Closed on
Mar 3, 2007
Sold by
Deonarine Anand and Deonarine Kelvin
Bought by
Deonarine Kelvin
Purchase Details
Closed on
Jan 31, 2003
Sold by
Deonarine Anand
Bought by
Deonarine Anand and Deonarine Kelvin
Purchase Details
Closed on
Mar 25, 2001
Sold by
Deonarine Angele
Bought by
Deonarine Anand
Purchase Details
Closed on
Oct 24, 2000
Sold by
Messano Anna Jeanne and Mejia Anna M
Bought by
Deonarine Angele
Purchase Details
Closed on
Oct 13, 2000
Sold by
Majia Raul
Bought by
Messano Anna Jeanne and Mejia Anna M
Purchase Details
Closed on
Aug 5, 1997
Sold by
Schreck A Edwin and Schreck Beryle J
Bought by
Mejia Raul and Mejia Anna M
Home Financials for this Owner
Home Financials are based on the most recent Mortgage that was taken out on this home.
Original Mortgage
$30,644
Interest Rate
7.61%
Create a Home Valuation Report for This Property
The Home Valuation Report is an in-depth analysis detailing your home's value as well as a comparison with similar homes in the area
Home Values in the Area
Average Home Value in this Area
Purchase History
| Date | Buyer | Sale Price | Title Company |
|---|---|---|---|
| Solomon Fareeza | -- | None Listed On Document | |
| Solomon Fareeza | -- | None Listed On Document | |
| Deonarine Kelvin | -- | None Available | |
| Deonarine Anand | -- | -- | |
| Deonarine Anand | -- | -- | |
| Deonarine Angele | $55,000 | -- | |
| Messano Anna Jeanne | -- | -- | |
| Mejia Raul | $40,057 | -- |
Source: Public Records
Mortgage History
| Date | Status | Borrower | Loan Amount |
|---|---|---|---|
| Previous Owner | Mejia Raul | $30,644 |
Source: Public Records
Tax History
| Year | Tax Paid | Tax Assessment Tax Assessment Total Assessment is a certain percentage of the fair market value that is determined by local assessors to be the total taxable value of land and additions on the property. | Land | Improvement |
|---|---|---|---|---|
| 2025 | $6,875 | $582,742 | $327,462 | $255,280 |
| 2024 | $6,872 | $625,497 | -- | -- |
| 2023 | $6,872 | $568,634 | $0 | $0 |
| 2022 | $6,378 | $516,940 | $0 | $0 |
| 2021 | $5,654 | $469,945 | $162,094 | $307,851 |
| 2020 | $5,504 | $461,429 | $164,588 | $296,841 |
| 2019 | $5,447 | $453,244 | $167,081 | $286,163 |
| 2018 | $5,383 | $448,500 | $174,563 | $273,937 |
| 2017 | $5,186 | $428,261 | $149,625 | $278,636 |
| 2016 | $4,785 | $393,443 | $0 | $0 |
| 2015 | $4,706 | $372,285 | $0 | $0 |
| 2014 | $4,276 | $338,441 | $0 | $0 |
Source: Public Records
Map
Nearby Homes
- 3508 Magenta Ct Unit 17
- 2034 Pine Isle Ln Unit 2034
- 1009 Pine Isle Ln Unit 1009
- 2069 Pine Isle Ln Unit 2069
- 2005 Pine Isle Ln Unit 2005
- 2048 Pine Isle Ln Unit 2048
- 2066 Pine Isle Ln Unit 2066
- 1031 Pine Isle Ln
- 3688 Kent Dr
- 2031 Pine Isle Ln Unit 2031
- 3420 Bedford Ct
- 3579 Kent Dr
- 1014 Pine Isle Ln Unit 1014
- 1006 Pine Isle Ln Unit 1006
- 3195 Boca Ciega Dr Unit C-10
- 3103 Boca Ciega Dr
- 3119 Boca Ciega Dr
- 3119 Boca Ciega Dr Unit B8
- 3375 Boca Ciega Dr
- 3127 Boca Ciega Dr Unit B-6
- 4818 Berkeley Dr
- 3305 Duchess Dr
- 4834 Berkeley Dr
- 4801 Berkeley Dr
- 3308 Duchess Dr
- 3297 Duchess Dr
- 4817 Berkeley Dr
- 4261 Shetland Ct Unit 206
- 4261 Shetland Ct Unit 205
- 4261 Shetland Ct Unit 204
- 4261 Shetland Ct Unit 203
- 4261 Shetland Ct Unit 202
- 4261 Shetland Ct Unit 201
- 4261 Shetland Ct Unit 106
- 4261 Shetland Ct Unit 105
- 4261 Shetland Ct Unit 104
- 4261 Shetland Ct Unit 103
- 4261 Shetland Ct Unit 101
- 3304 Duchess Dr Unit 6
- 3304 Duchess Dr
Your Personal Tour Guide
Ask me questions while you tour the home.