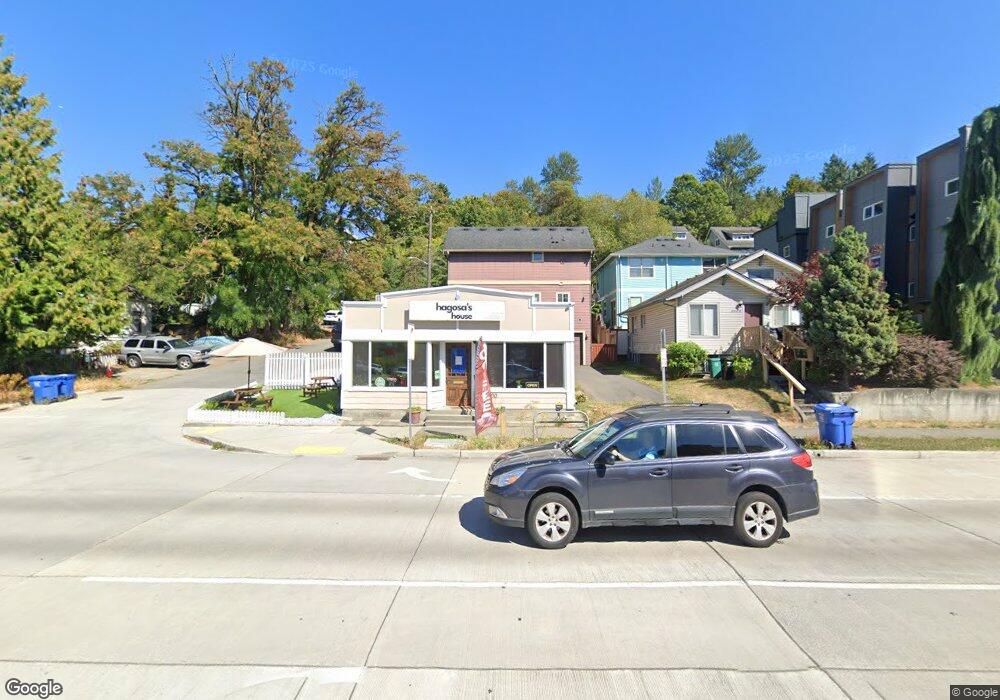
4800 Delridge Way SW Seattle, WA 98106
North Delridge NeighborhoodEstimated Value: $531,210
--
Bed
--
Bath
780
Sq Ft
$681/Sq Ft
Est. Value
About This Home
This home is located at 4800 Delridge Way SW, Seattle, WA 98106 and is currently estimated at $531,210, approximately $681 per square foot. 4800 Delridge Way SW is a home located in King County with nearby schools including Fairmount Park Elementary, Madison Middle School, and West Seattle High School.
Ownership History
Date
Name
Owned For
Owner Type
Purchase Details
Closed on
Mar 27, 2008
Sold by
Duffus Daniel
Bought by
Tesfu Solomon and Berhane Genet
Current Estimated Value
Home Financials for this Owner
Home Financials are based on the most recent Mortgage that was taken out on this home.
Original Mortgage
$125,000
Outstanding Balance
$78,144
Interest Rate
5.72%
Estimated Equity
$453,066
Purchase Details
Closed on
Jun 20, 2007
Sold by
Hanes Michelle L
Bought by
Duffus Daniel
Purchase Details
Closed on
Oct 31, 2006
Sold by
Soleil Llc
Bought by
Epic Homes Inc
Purchase Details
Closed on
Oct 30, 2006
Sold by
Soleil Llc
Bought by
Duffus Daniel and Hanes Michelle L
Purchase Details
Closed on
Apr 11, 2006
Sold by
Nobles Joan
Bought by
Soleil Llc
Home Financials for this Owner
Home Financials are based on the most recent Mortgage that was taken out on this home.
Original Mortgage
$192,000
Interest Rate
6.2%
Purchase Details
Closed on
Sep 20, 1988
Sold by
English Elsie
Bought by
Nobles Joan
Create a Home Valuation Report for This Property
The Home Valuation Report is an in-depth analysis detailing your home's value as well as a comparison with similar homes in the area
Home Values in the Area
Average Home Value in this Area
Purchase History
| Date | Buyer | Sale Price | Title Company |
|---|---|---|---|
| Tesfu Solomon | $250,000 | Fidelity National Title | |
| Duffus Daniel | -- | None Available | |
| Epic Homes Inc | $195,000 | Fidelity Natio | |
| Duffus Daniel | -- | Fidelity Natio | |
| Soleil Llc | $240,000 | Fidelity Natio | |
| Nobles Joan | $52,000 | -- |
Source: Public Records
Mortgage History
| Date | Status | Borrower | Loan Amount |
|---|---|---|---|
| Open | Tesfu Solomon | $125,000 | |
| Previous Owner | Soleil Llc | $192,000 |
Source: Public Records
Tax History Compared to Growth
Tax History
| Year | Tax Paid | Tax Assessment Tax Assessment Total Assessment is a certain percentage of the fair market value that is determined by local assessors to be the total taxable value of land and additions on the property. | Land | Improvement |
|---|---|---|---|---|
| 2024 | $2,632 | $241,300 | $173,200 | $68,100 |
| 2023 | $1,903 | $210,900 | $173,200 | $37,700 |
| 2022 | $2,204 | $189,800 | $155,000 | $34,800 |
| 2021 | $2,283 | $210,900 | $142,200 | $68,700 |
| 2020 | $2,151 | $210,900 | $136,800 | $74,100 |
| 2018 | $1,882 | $175,900 | $109,400 | $66,500 |
| 2017 | $1,807 | $169,800 | $100,300 | $69,500 |
| 2016 | $1,699 | $169,800 | $91,200 | $78,600 |
| 2015 | $1,651 | $164,200 | $91,200 | $73,000 |
| 2014 | -- | $164,200 | $91,200 | $73,000 |
| 2013 | -- | $168,700 | $91,200 | $77,500 |
Source: Public Records
Map
Nearby Homes
- 4802 Delridge Way SW
- 4745 Delridge Way SW
- 4548 23rd Ave SW
- 4700 26th Ave SW
- 0 23rd Ave SW Unit NWM2434432
- 4572 22nd Ave SW
- 5033 25th Ave SW Unit B
- 5246 21st Ave SW Unit A
- 5257 23rd Ave SW
- 5248 23rd Ave SW
- 5252 23rd Ave SW
- 2401 SW Brandon St Unit 202
- 5427 25th Ave SW
- 5437 25th Ave SW
- 4133 23rd Ave SW
- 5258 17th Ave SW
- 5456 Delridge Way SW
- 4116 25th Ave SW
- 5606 23rd Ave SW
- 5605 25th Ave SW
- 2317 SW Edmunds St
- 4804 Delridge Way SW
- 4804 Delridge Way SW Unit A & B
- 2315 SW Edmunds St
- 4802 Delridge Way SW Unit B
- 4810C Delridge Way SW
- 4810 Delridge Way SW
- 4810A Delridge Way SW
- 4756 Delridge Way SW
- 4814 Delridge Way SW
- 2401 SW Edmunds St
- 4816 Delridge Way SW Unit A
- 4816 Delridge Way SW Unit B
- 2403 SW Edmunds St
- 4752 Delridge Way SW Unit Upper
- 4752 Delridge Way SW Unit 1 & 2
- 4752 Delridge Way SW
- 4805 Delridge Way SW
- 4816B Delridge Way SW
- 2405 SW Edmunds St