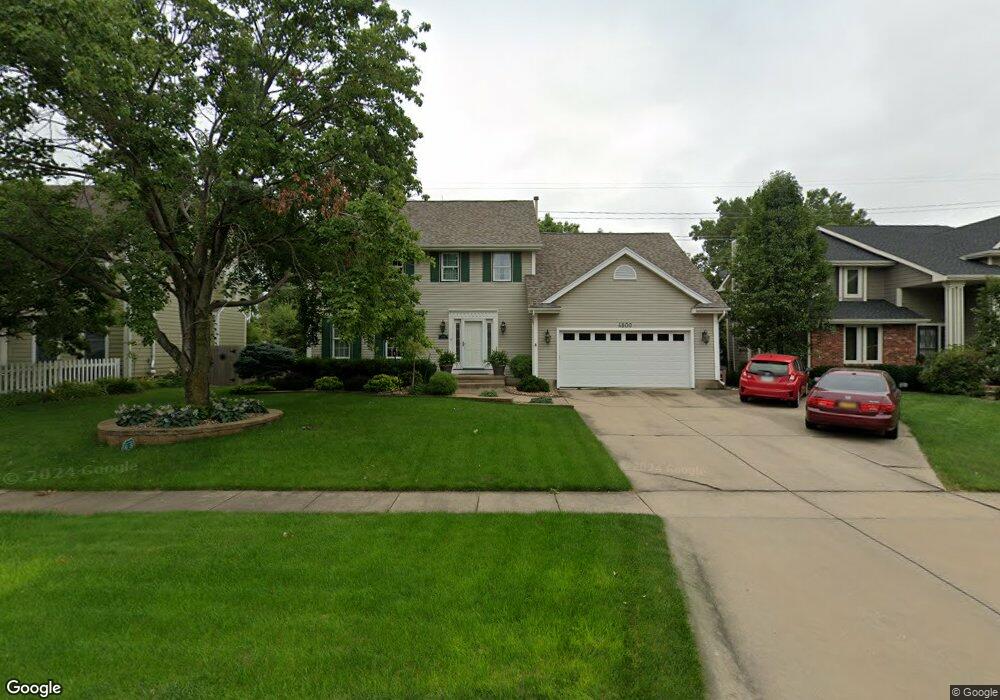
4800 Elm St West Des Moines, IA 50265
Estimated Value: $404,977 - $442,000
4
Beds
3
Baths
2,603
Sq Ft
$166/Sq Ft
Est. Value
About This Home
This home is located at 4800 Elm St, West Des Moines, IA 50265 and is currently estimated at $431,244, approximately $165 per square foot. 4800 Elm St is a home located in Polk County with nearby schools including Western Hills Elementary School, Valley Southwoods Freshman High School, and Stilwell Junior High School.
Ownership History
Date
Name
Owned For
Owner Type
Purchase Details
Closed on
Jan 24, 2012
Sold by
Lagomarcino Mark S and Lagomarcino Teresa A
Bought by
Williams Michael L and Williams Cheryl J
Current Estimated Value
Home Financials for this Owner
Home Financials are based on the most recent Mortgage that was taken out on this home.
Original Mortgage
$167,000
Outstanding Balance
$18,282
Interest Rate
3.19%
Mortgage Type
New Conventional
Estimated Equity
$412,962
Create a Home Valuation Report for This Property
The Home Valuation Report is an in-depth analysis detailing your home's value as well as a comparison with similar homes in the area
Home Values in the Area
Average Home Value in this Area
Purchase History
| Date | Buyer | Sale Price | Title Company |
|---|---|---|---|
| Williams Michael L | $219,500 | None Available |
Source: Public Records
Mortgage History
| Date | Status | Borrower | Loan Amount |
|---|---|---|---|
| Open | Williams Michael L | $167,000 |
Source: Public Records
Tax History Compared to Growth
Tax History
| Year | Tax Paid | Tax Assessment Tax Assessment Total Assessment is a certain percentage of the fair market value that is determined by local assessors to be the total taxable value of land and additions on the property. | Land | Improvement |
|---|---|---|---|---|
| 2025 | $5,730 | $390,300 | $75,100 | $315,200 |
| 2024 | $5,730 | $372,000 | $70,800 | $301,200 |
| 2023 | $5,824 | $372,000 | $70,800 | $301,200 |
| 2022 | $5,754 | $310,500 | $60,800 | $249,700 |
| 2021 | $5,652 | $310,500 | $60,800 | $249,700 |
| 2020 | $5,562 | $290,400 | $56,800 | $233,600 |
| 2019 | $5,394 | $290,400 | $56,800 | $233,600 |
| 2018 | $5,402 | $271,800 | $52,200 | $219,600 |
| 2017 | $5,242 | $271,800 | $52,200 | $219,600 |
| 2016 | $5,124 | $256,500 | $48,700 | $207,800 |
| 2015 | $5,124 | $256,500 | $48,700 | $207,800 |
| 2014 | $4,310 | $221,400 | $44,500 | $176,900 |
Source: Public Records
Map
Nearby Homes
- 4808 Stonebridge Rd
- 521 51st St
- 513 52nd St
- 636 47th St
- 455 52nd Place
- 4400 Ep True Pkwy Unit 43
- 4400 Ep True Pkwy Unit 25
- 4721 Westwood Dr
- 5101 Dakota Dr
- 108 S 46th St
- 5242 Dakota Dr
- 4208 Maple St
- 4600 Aspen Dr
- 5255 Dakota Dr
- 4100 Walnut St
- 181 52nd St
- 4801 Meadow Valley Dr
- 5207 Pommel Place
- 509 53rd St
- 4300 Pommel Place