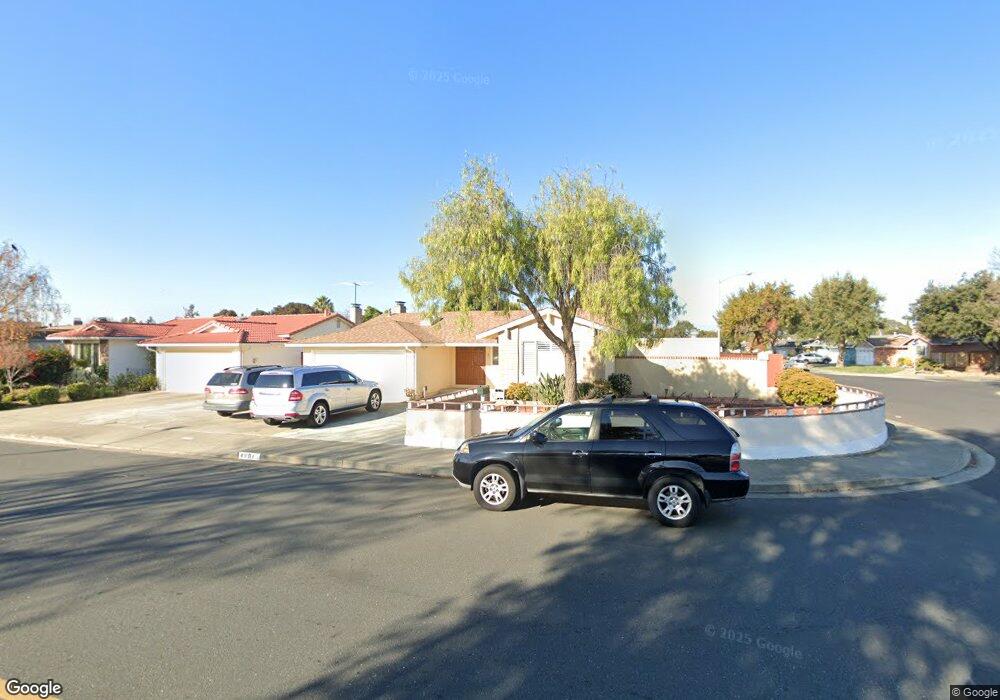
4801 Rose Way Union City, CA 94587
Alvarado NeighborhoodEstimated Value: $1,444,000 - $1,726,316
4
Beds
2
Baths
2,400
Sq Ft
$681/Sq Ft
Est. Value
About This Home
This home is located at 4801 Rose Way, Union City, CA 94587 and is currently estimated at $1,635,329, approximately $681 per square foot. 4801 Rose Way is a home located in Alameda County with nearby schools including Delaine Eastin Elementary School, Itliong-Vera Cruz, and James Logan High School.
Ownership History
Date
Name
Owned For
Owner Type
Purchase Details
Closed on
Aug 13, 2021
Sold by
Ngo Tuong T and Luong Van M
Bought by
Ngo Tuong Tap and Luong Van My
Current Estimated Value
Purchase Details
Closed on
Apr 11, 2011
Sold by
Aurorasky Investments Llc
Bought by
Ngo Tuong T and Luong Van M
Home Financials for this Owner
Home Financials are based on the most recent Mortgage that was taken out on this home.
Original Mortgage
$412,000
Outstanding Balance
$284,641
Interest Rate
4.83%
Mortgage Type
New Conventional
Estimated Equity
$1,350,688
Purchase Details
Closed on
Apr 8, 2010
Sold by
Aquino Salvador G and Aquino Luz C
Bought by
Aurorasky Investment Llc
Purchase Details
Closed on
Jun 8, 1994
Sold by
Aquino Luzviminda C
Bought by
Aquino Salvador G and Aquino Luzviminda C
Purchase Details
Closed on
Apr 18, 1994
Sold by
Aquino Salvador G
Bought by
Aquino Luz C
Create a Home Valuation Report for This Property
The Home Valuation Report is an in-depth analysis detailing your home's value as well as a comparison with similar homes in the area
Home Values in the Area
Average Home Value in this Area
Purchase History
| Date | Buyer | Sale Price | Title Company |
|---|---|---|---|
| Ngo Tuong Tap | -- | None Available | |
| Ngo Tuong T | $515,000 | Old Republic Title Company | |
| Aurorasky Investment Llc | $427,000 | None Available | |
| Aquino Salvador G | -- | -- | |
| Aquino Luz C | -- | -- |
Source: Public Records
Mortgage History
| Date | Status | Borrower | Loan Amount |
|---|---|---|---|
| Open | Ngo Tuong T | $412,000 |
Source: Public Records
Tax History Compared to Growth
Tax History
| Year | Tax Paid | Tax Assessment Tax Assessment Total Assessment is a certain percentage of the fair market value that is determined by local assessors to be the total taxable value of land and additions on the property. | Land | Improvement |
|---|---|---|---|---|
| 2025 | $9,524 | $652,765 | $197,929 | $461,836 |
| 2024 | $9,524 | $639,834 | $194,050 | $452,784 |
| 2023 | $9,215 | $634,154 | $190,246 | $443,908 |
| 2022 | $9,052 | $614,723 | $186,517 | $435,206 |
| 2021 | $8,850 | $602,533 | $182,860 | $426,673 |
| 2020 | $8,675 | $603,285 | $180,985 | $422,300 |
| 2019 | $8,757 | $591,461 | $177,438 | $414,023 |
| 2018 | $8,553 | $579,868 | $173,960 | $405,908 |
| 2017 | $8,349 | $568,503 | $170,551 | $397,952 |
| 2016 | $8,046 | $557,358 | $167,207 | $390,151 |
| 2015 | $7,893 | $548,990 | $164,697 | $384,293 |
| 2014 | $7,597 | $538,236 | $161,471 | $376,765 |
Source: Public Records
Map
Nearby Homes
- 4639 Michelle Ct
- 32409 Elizabeth Way
- 4611 Carmen Way
- 32447 Pacific Grove Way
- 32451 Regents Blvd
- 4506 Birchwood Ct
- 4532 Delores Dr
- 32945 Regents Blvd
- 33064 Compton Ct
- 34102 Zaner Way
- 4633 Granada Way
- 4201 Saturn Way
- 4214 Saturn Way
- 4475 Queen Anne Dr
- 4231 Hanford St
- 4243 Comet Cir
- 4263 Queen Anne Dr
- 4100 Aquarius Cir
- 4167 Sunflower Ct
- 4272 Warbler Loop
- 4807 Rose Way
- 32356 Jacklynn Ct
- 32352 Jacklynn Ct
- 4813 Rose Way
- 32433 Jacklynn Dr
- 32444 Jacklynn Dr
- 32437 Jacklynn Dr
- 32441 Jacklynn Dr
- 4806 Rose Way
- 4819 Rose Way
- 32345 Jacklynn Dr
- 32348 Jacklynn Ct
- 4812 Rose Way
- 4738 Rose Way
- 32448 Jacklynn Dr
- 32445 Jacklynn Dr
- 32341 Jacklynn Dr
- 32344 Jacklynn Ct
- 4825 Rose Way
- 4818 Rose Way