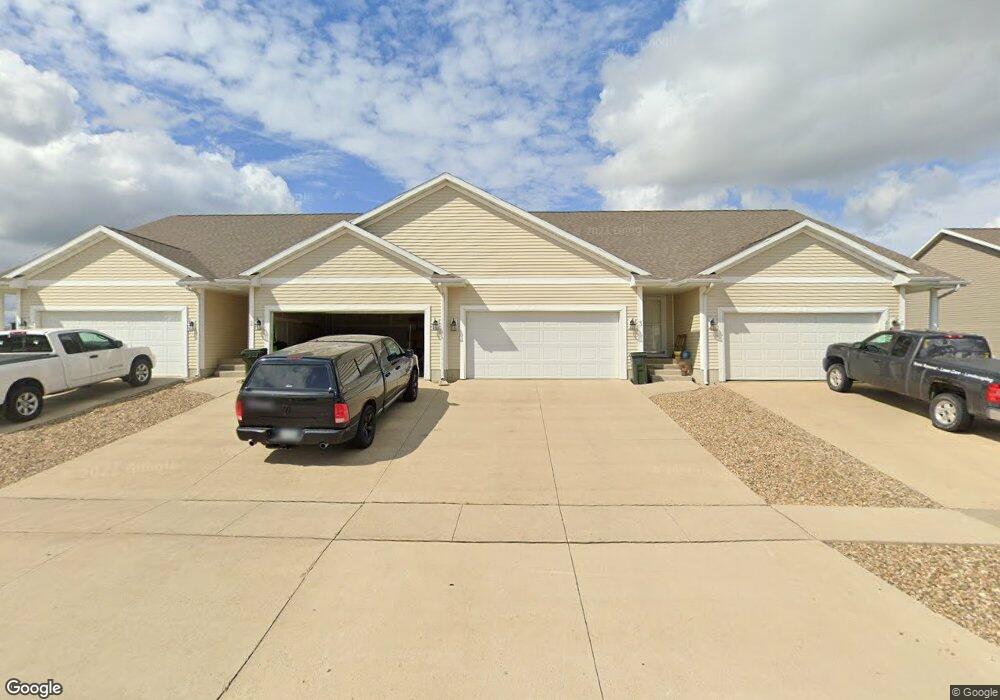
4802 Algonquin Dr Unit 2 Cedar Falls, IA 50613
Estimated Value: $215,358 - $245,000
3
Beds
3
Baths
1,645
Sq Ft
$141/Sq Ft
Est. Value
About This Home
This home is located at 4802 Algonquin Dr Unit 2, Cedar Falls, IA 50613 and is currently estimated at $231,590, approximately $140 per square foot. 4802 Algonquin Dr Unit 2 is a home located in Black Hawk County with nearby schools including Southdale Elementary School, Peet Junior High School, and Cedar Falls High School.
Ownership History
Date
Name
Owned For
Owner Type
Purchase Details
Closed on
Aug 28, 2014
Sold by
Corwin Jody L and Corwin Rory Dean
Bought by
Chrismark Enterprises Llc
Current Estimated Value
Home Financials for this Owner
Home Financials are based on the most recent Mortgage that was taken out on this home.
Original Mortgage
$163,400
Outstanding Balance
$124,592
Interest Rate
4.11%
Mortgage Type
Future Advance Clause Open End Mortgage
Estimated Equity
$106,998
Purchase Details
Closed on
May 1, 2013
Sold by
Sellick Sara Lynne and Selleck Sara Lynne
Bought by
Corwin Jody L
Home Financials for this Owner
Home Financials are based on the most recent Mortgage that was taken out on this home.
Original Mortgage
$128,800
Interest Rate
3.51%
Mortgage Type
New Conventional
Purchase Details
Closed on
Jul 3, 2008
Sold by
Co Greenhill Village Townhomes Lc
Bought by
Hensing Sara Lynne
Home Financials for this Owner
Home Financials are based on the most recent Mortgage that was taken out on this home.
Original Mortgage
$140,362
Interest Rate
5.96%
Mortgage Type
New Conventional
Create a Home Valuation Report for This Property
The Home Valuation Report is an in-depth analysis detailing your home's value as well as a comparison with similar homes in the area
Home Values in the Area
Average Home Value in this Area
Purchase History
| Date | Buyer | Sale Price | Title Company |
|---|---|---|---|
| Chrismark Enterprises Llc | $172,000 | None Available | |
| Corwin Jody L | $161,000 | Title Services Corporation | |
| Hensing Sara Lynne | $148,000 | None Available |
Source: Public Records
Mortgage History
| Date | Status | Borrower | Loan Amount |
|---|---|---|---|
| Open | Chrismark Enterprises Llc | $163,400 | |
| Previous Owner | Corwin Jody L | $128,800 | |
| Previous Owner | Hensing Sara Lynne | $140,362 |
Source: Public Records
Tax History
| Year | Tax Paid | Tax Assessment Tax Assessment Total Assessment is a certain percentage of the fair market value that is determined by local assessors to be the total taxable value of land and additions on the property. | Land | Improvement |
|---|---|---|---|---|
| 2025 | $2,818 | $199,140 | $19,310 | $179,830 |
| 2024 | $2,818 | $175,110 | $19,310 | $155,800 |
| 2023 | $3,092 | $175,110 | $19,310 | $155,800 |
| 2022 | $3,130 | $167,540 | $14,850 | $152,690 |
| 2021 | $2,942 | $167,540 | $14,850 | $152,690 |
| 2020 | $2,884 | $158,000 | $14,850 | $143,150 |
| 2019 | $2,884 | $158,000 | $14,850 | $143,150 |
| 2018 | $2,920 | $158,000 | $14,850 | $143,150 |
| 2017 | $3,102 | $158,000 | $14,850 | $143,150 |
| 2016 | $2,904 | $164,320 | $11,630 | $152,690 |
| 2015 | $2,904 | $164,320 | $11,630 | $152,690 |
| 2014 | $2,766 | $154,780 | $11,630 | $143,150 |
Source: Public Records
Map
Nearby Homes
- 1113 Amelia Dr Unit 1
- 1122 Algonquin Dr
- 0 Greenhill Crossing Outlots Y & B
- 4503 Wild Rose Ct
- 4724 Donald Dr
- 4306 Spruce Creek Dr
- 1805 Ashworth Dr
- Lot 15 Ashworth Dr
- Lot 9 Ashworth Dr
- Lot 14 Ashworth Dr
- Lot 19 Ashworth Dr
- Lot 22 Ashworth Dr
- Lot 13 Ashworth Dr
- Lot 17 Ashworth Dr
- Lot 16 Ashworth Dr
- Lot 2 Ashworth Dr
- Lot 5 Ashworth Dr
- Lot 6 Ashworth Dr
- Lot 21 Ashworth Dr
- Lot 1 Ashworth Dr
- 4802 Algonquin Dr Unit 4
- 4802 Algonquin Dr Unit 3
- 4802 Algonquin Dr Unit 1
- 4808 Algonquin Dr Unit 4
- 4808 Algonquin Dr Unit 5
- 4808 Algonquin Dr Unit 3
- 4808 Algonquin Dr Unit 2
- 4808 Algonquin Dr Unit 1
- 4748 Loren Dr
- 4805 Algonquin Dr Unit 4
- 4805 Algonquin Dr Unit 3
- 4805 Algonquin Dr Unit 1
- Lot 31 Ashworth Dr
- Lot 38 Ashworth Dr
- Lot 30 Ashworth Dr
- Lot 39 Ashworth Dr
- Lot 34 Ashworth Dr
- Lot 33 Ashworth Dr
- Lot 29 Ashworth Dr
- Lot 35 Ashworth Dr
Your Personal Tour Guide
Ask me questions while you tour the home.