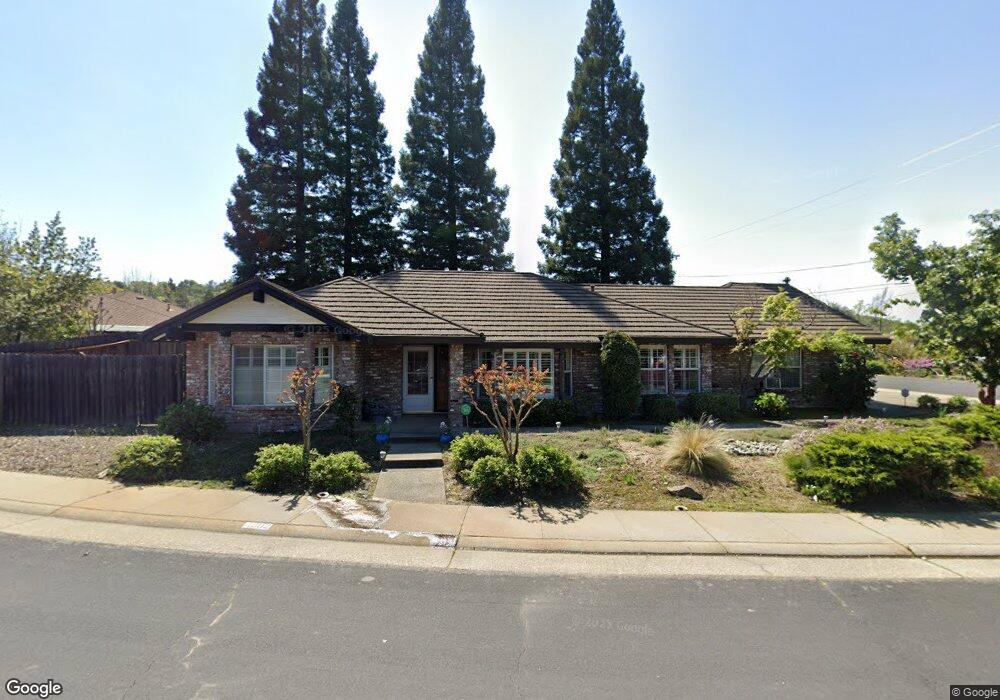
4802 Buxton Way Rocklin, CA 95677
Secret Ravine-Sierra Bluff NeighborhoodEstimated Value: $624,000 - $726,713
3
Beds
2
Baths
1,888
Sq Ft
$369/Sq Ft
Est. Value
About This Home
This home is located at 4802 Buxton Way, Rocklin, CA 95677 and is currently estimated at $695,928, approximately $368 per square foot. 4802 Buxton Way is a home located in Placer County with nearby schools including Sierra Elementary School, Spring View Middle School, and Whitney High.
Ownership History
Date
Name
Owned For
Owner Type
Purchase Details
Closed on
Aug 19, 2010
Sold by
Wygal Donald R and Wygal Mary K
Bought by
Wygal Donald Ray and Wygal Mary Kathryn
Current Estimated Value
Home Financials for this Owner
Home Financials are based on the most recent Mortgage that was taken out on this home.
Original Mortgage
$132,500
Outstanding Balance
$87,506
Interest Rate
4.52%
Mortgage Type
New Conventional
Estimated Equity
$608,422
Purchase Details
Closed on
May 10, 2005
Sold by
Rose John W
Bought by
Wygal Donald Ray and Wygal Mary Kathryn
Purchase Details
Closed on
Dec 30, 2002
Sold by
Rose John W
Bought by
Rose John W
Home Financials for this Owner
Home Financials are based on the most recent Mortgage that was taken out on this home.
Original Mortgage
$258,400
Interest Rate
5.96%
Purchase Details
Closed on
Jul 24, 1997
Sold by
Rose Karen L
Bought by
Rose John W
Home Financials for this Owner
Home Financials are based on the most recent Mortgage that was taken out on this home.
Original Mortgage
$192,600
Interest Rate
7.58%
Create a Home Valuation Report for This Property
The Home Valuation Report is an in-depth analysis detailing your home's value as well as a comparison with similar homes in the area
Home Values in the Area
Average Home Value in this Area
Purchase History
| Date | Buyer | Sale Price | Title Company |
|---|---|---|---|
| Wygal Donald Ray | -- | Old Republic Title Company | |
| Wygal Donald R | -- | Old Republic Title Company | |
| Wygal Donald Ray | $490,000 | North American Title | |
| Rose John W | -- | Sierra Valley Title | |
| Rose John W | -- | Placer Title Company |
Source: Public Records
Mortgage History
| Date | Status | Borrower | Loan Amount |
|---|---|---|---|
| Open | Wygal Donald R | $132,500 | |
| Previous Owner | Rose John W | $258,400 | |
| Previous Owner | Rose John W | $192,600 | |
| Closed | Rose John W | $25,000 |
Source: Public Records
Tax History Compared to Growth
Tax History
| Year | Tax Paid | Tax Assessment Tax Assessment Total Assessment is a certain percentage of the fair market value that is determined by local assessors to be the total taxable value of land and additions on the property. | Land | Improvement |
|---|---|---|---|---|
| 2025 | $7,315 | $683,001 | $278,771 | $404,230 |
| 2023 | $7,315 | $656,481 | $267,947 | $388,534 |
| 2022 | $7,076 | $643,610 | $262,694 | $380,916 |
| 2021 | $6,367 | $574,000 | $234,300 | $339,700 |
| 2020 | $5,864 | $524,000 | $213,900 | $310,100 |
| 2019 | $5,932 | $527,000 | $215,100 | $311,900 |
| 2018 | $5,199 | $465,000 | $189,800 | $275,200 |
| 2017 | $5,160 | $452,000 | $184,500 | $267,500 |
| 2016 | $5,021 | $444,000 | $181,200 | $262,800 |
| 2015 | $4,818 | $568,299 | $231,956 | $336,343 |
| 2014 | $4,463 | $393,000 | $160,400 | $232,600 |
Source: Public Records
Map
Nearby Homes
- 4718 El Cid Ct
- 4701 El Cid Ct
- 4525 Greenbrae Rd
- 4603 Ring Neck Ln
- 0 Ambassador Dr Unit 225028788
- 6305 Galaxy Ln
- 6308 Galaxy Ln
- 4212 Rockwood St
- 4279 Fernwood St Unit 39
- 4261 Fernwood St Unit 33
- 4251 Pinewood St
- 4275 Fernwood St
- 5950 Tanus Cir
- 5500- China Garden Rd
- Residence Three Plan at Granite Terrace
- Residence One Plan at Granite Terrace
- Residence Two Plan at Granite Terrace
- Residence Four Plan at Granite Terrace
- 4400 Redstart Ln Unit Lot16
- 4405 Redstart Ln Unit Lot03
- 5785 Foothill Rd
- 4801 Buxton Way
- 4806 Buxton Way
- 5601 Coleman Ct
- 5795 Foothill Rd
- 5750 Foothill Rd
- 5700 Foothill Rd
- 5693 Foothill Rd
- 4810 Buxton Way
- 5608 Coleman Ct
- 5800 Foothill Rd
- 5603 Coleman Ct
- 5690 Foothill Rd
- 5001 Southside Ranch Rd
- 4815 Buxton Way
- 4814 Buxton Way
- 5604 Coleman Ct
- 5003 Southside Ranch Rd
- 4934 El Ranchero Ct
- 4758 Paradise Ct