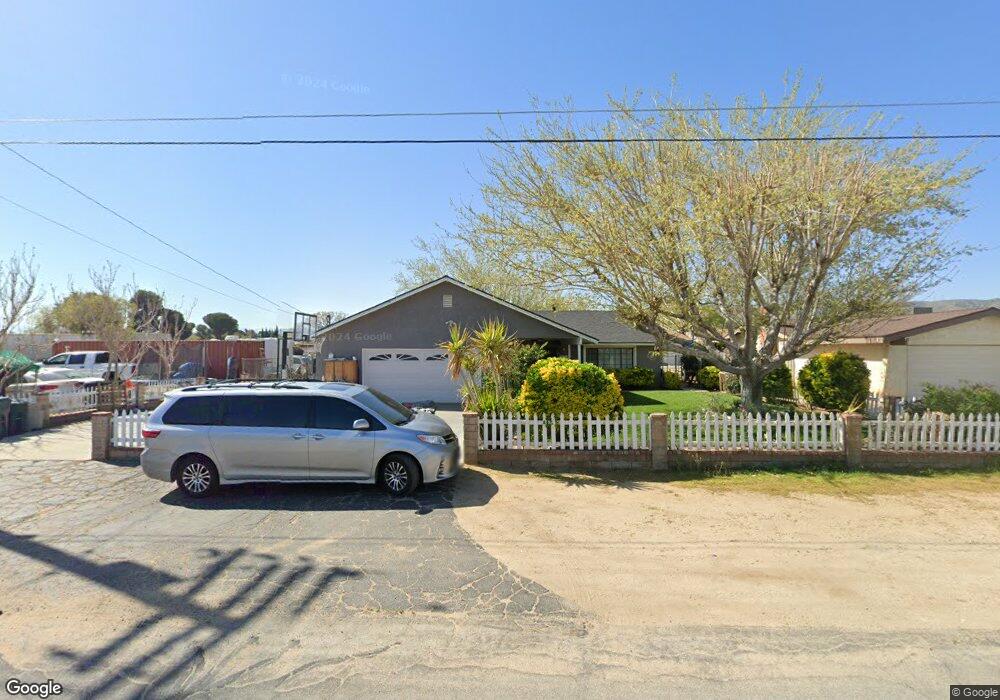
4802 W Avenue l6 Lancaster, CA 93536
Quartz Hill NeighborhoodEstimated Value: $501,000 - $576,000
3
Beds
2
Baths
1,778
Sq Ft
$300/Sq Ft
Est. Value
About This Home
This home is located at 4802 W Avenue l6, Lancaster, CA 93536 and is currently estimated at $533,949, approximately $300 per square foot. 4802 W Avenue l6 is a home located in Los Angeles County with nearby schools including Valley View Elementary School, Joe Walker Middle School, and Quartz Hill High School.
Ownership History
Date
Name
Owned For
Owner Type
Purchase Details
Closed on
Sep 16, 2020
Sold by
Velasquez Ceron Karla M
Bought by
Torres Marlon Daniel
Current Estimated Value
Purchase Details
Closed on
Aug 31, 2020
Sold by
Quintanilla Jennifer
Bought by
Torres Marlon Daniel
Purchase Details
Closed on
Jan 6, 2010
Sold by
Torres Henry David
Bought by
Quintanilla Jennifer
Home Financials for this Owner
Home Financials are based on the most recent Mortgage that was taken out on this home.
Original Mortgage
$180,000
Interest Rate
4.68%
Mortgage Type
New Conventional
Purchase Details
Closed on
Oct 20, 2009
Sold by
Gray Herman L and Gray Antonette
Bought by
Quintanilla Jennifer
Home Financials for this Owner
Home Financials are based on the most recent Mortgage that was taken out on this home.
Original Mortgage
$9,000
Interest Rate
4.78%
Mortgage Type
Purchase Money Mortgage
Create a Home Valuation Report for This Property
The Home Valuation Report is an in-depth analysis detailing your home's value as well as a comparison with similar homes in the area
Home Values in the Area
Average Home Value in this Area
Purchase History
| Date | Buyer | Sale Price | Title Company |
|---|---|---|---|
| Torres Marlon Daniel | -- | Wfg National Title Co Of Ca | |
| Torres Marlon Daniel | $107,000 | Wfg National Title Company | |
| Quintanilla Jennifer | -- | Fidelity Van Nuys | |
| Quintanilla Jennifer | $225,000 | Fidelity Van Nuys |
Source: Public Records
Mortgage History
| Date | Status | Borrower | Loan Amount |
|---|---|---|---|
| Previous Owner | Quintanilla Jennifer | $180,000 | |
| Previous Owner | Quintanilla Jennifer | $9,000 |
Source: Public Records
Tax History Compared to Growth
Tax History
| Year | Tax Paid | Tax Assessment Tax Assessment Total Assessment is a certain percentage of the fair market value that is determined by local assessors to be the total taxable value of land and additions on the property. | Land | Improvement |
|---|---|---|---|---|
| 2025 | $6,170 | $460,030 | $114,952 | $345,078 |
| 2024 | $6,170 | $451,011 | $112,699 | $338,312 |
| 2023 | $6,120 | $442,169 | $110,490 | $331,679 |
| 2022 | $6,020 | $433,500 | $108,324 | $325,176 |
| 2021 | $5,925 | $425,000 | $106,200 | $318,800 |
| 2019 | $3,924 | $260,348 | $52,066 | $208,282 |
| 2018 | $3,874 | $255,245 | $51,046 | $204,199 |
| 2016 | $3,669 | $245,336 | $49,065 | $196,271 |
| 2015 | $3,628 | $241,651 | $48,328 | $193,323 |
| 2014 | $3,364 | $216,000 | $43,200 | $172,800 |
Source: Public Records
Map
Nearby Homes
- 0 W Unit 25005626
- 42434 Blossom Dr
- 42346 47th St W
- 42628 47th St W
- 5033 W Avenue L-10 Unit 14
- 5038 W Avenue l10
- 4554 Meadow Place
- 42502 52nd St W
- 4748 W Avenue L
- 4742 W Avenue l12
- 4541 W Avenue l2
- 4807 W Avenue L
- 4741 W Avenue L
- 5121 W Avenue l12
- 0 W Avenue L
- 5237 W Avenue l8
- 4803 Avenue L-14
- 4803 W Avenue l14
- 4741 W Avenue l14
- 4741 Avenue L-14
- 4810 W Avenue l6
- 4820 W Avenue l6
- 5306 W Avenue L-6
- 4803 W Avenue l6
- 4755 W Avenue l6
- 4747 W Avenue l6
- 4830 W Avenue l6
- 4817 W Avenue l6
- 4742 W Avenue l6
- 4743 W Avenue l6
- 4807 W Avenue l6
- 4827 W Avenue l6
- 4834 W Avenue l6
- 4737 W Avenue l6
- 4730 W Avenue l6
- 4815 W Avenue l8
- 4731 W Avenue l6
- 4835 W Avenue l6
- 4846 W Avenue l6
- 4724 W Avenue l6