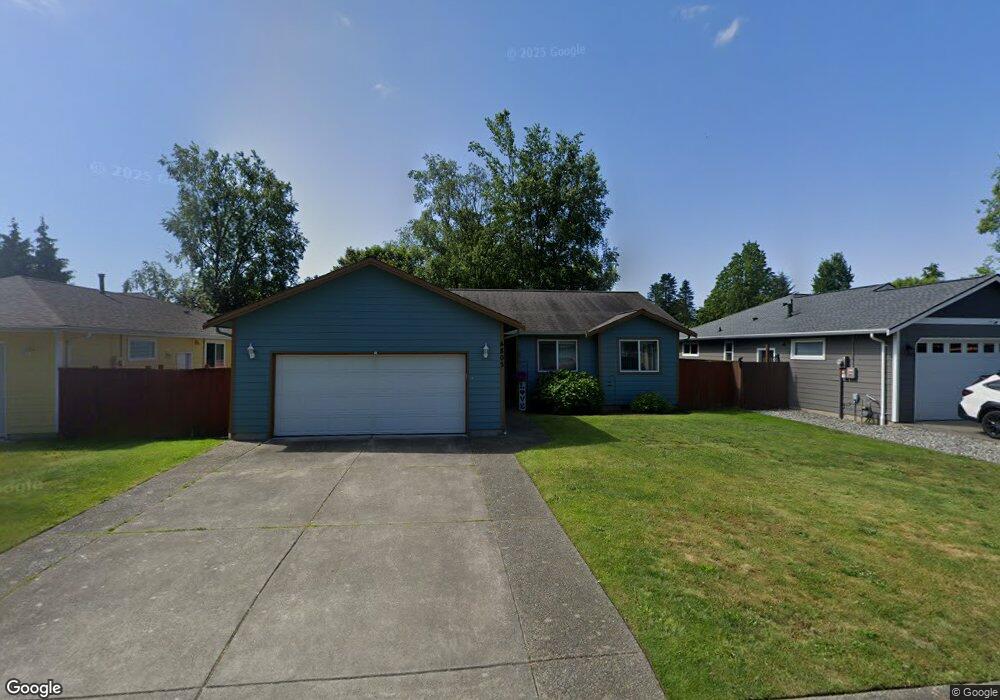
4803 Twilight Place Blaine, WA 98230
Estimated Value: $472,000 - $480,000
3
Beds
2
Baths
1,278
Sq Ft
$373/Sq Ft
Est. Value
About This Home
This home is located at 4803 Twilight Place, Blaine, WA 98230 and is currently estimated at $476,145, approximately $372 per square foot. 4803 Twilight Place is a home located in Whatcom County with nearby schools including Blaine Primary School, Blaine Elementary School, and Blaine Middle School.
Ownership History
Date
Name
Owned For
Owner Type
Purchase Details
Closed on
Jun 4, 2024
Sold by
Pansy L Jensen Living Trust and Nansen Peter D
Bought by
Nansen Teresa S
Current Estimated Value
Purchase Details
Closed on
Sep 1, 2017
Sold by
Jensen Pansy L
Bought by
The Pansy L Jensen Living Trust
Purchase Details
Closed on
May 26, 2005
Sold by
Mcgeachy Ernest
Bought by
Jensen Pansy L
Purchase Details
Closed on
Sep 26, 2003
Sold by
Mcgeachy Victoria
Bought by
Mcgeachy Ernest
Home Financials for this Owner
Home Financials are based on the most recent Mortgage that was taken out on this home.
Original Mortgage
$167,990
Interest Rate
6.17%
Mortgage Type
VA
Create a Home Valuation Report for This Property
The Home Valuation Report is an in-depth analysis detailing your home's value as well as a comparison with similar homes in the area
Home Values in the Area
Average Home Value in this Area
Purchase History
| Date | Buyer | Sale Price | Title Company |
|---|---|---|---|
| Nansen Teresa S | $313 | None Listed On Document | |
| The Pansy L Jensen Living Trust | $313 | None Listed On Document | |
| Jensen Pansy L | -- | None Available | |
| Jensen Pansy L | $197,500 | Whatcom Land Title | |
| Mcgeachy Ernest | -- | Stewart Title Company | |
| Mcgeachy Ernest | $141,565 | Stewart Title Company |
Source: Public Records
Mortgage History
| Date | Status | Borrower | Loan Amount |
|---|---|---|---|
| Previous Owner | Mcgeachy Ernest | $167,990 |
Source: Public Records
Tax History Compared to Growth
Tax History
| Year | Tax Paid | Tax Assessment Tax Assessment Total Assessment is a certain percentage of the fair market value that is determined by local assessors to be the total taxable value of land and additions on the property. | Land | Improvement |
|---|---|---|---|---|
| 2024 | $2,996 | $444,414 | $154,000 | $290,414 |
| 2023 | $2,996 | $444,414 | $154,000 | $290,414 |
| 2022 | $2,655 | $404,013 | $140,000 | $264,013 |
| 2021 | $2,546 | $300,502 | $101,586 | $198,916 |
| 2020 | $2,384 | $265,927 | $89,898 | $176,029 |
| 2019 | $2,259 | $240,050 | $81,150 | $158,900 |
| 2018 | $2,182 | $222,301 | $75,150 | $147,151 |
| 2017 | $1,788 | $193,815 | $65,520 | $128,295 |
| 2016 | $1,833 | $177,486 | $60,000 | $117,486 |
| 2015 | $1,796 | $175,296 | $60,222 | $115,074 |
| 2014 | -- | $167,753 | $57,630 | $110,123 |
| 2013 | -- | $165,923 | $57,000 | $108,923 |
Source: Public Records
Map
Nearby Homes
- 4844 Oakridge Dr
- 4755 Moonglow Place
- 8529 Tracy Place
- 4710 Sagebrush Ln
- 8429 Harborview Rd
- 8254 Breeze Loop
- 4641 California Trail
- 50 Acres Lincoln and Shintaffer Rd
- 8153 Harborview Rd
- 4955 Henley St
- 4542 Eddie Ln
- 5045 Maple St
- 4672 Birch Bay Lynden Rd Unit 63
- 4672 Birch Bay Lynden Rd Unit 87
- 4672 Birch Bay Lynden Rd Unit 158
- 8458 Shintaffer Rd
- 4435 Castlerock Dr
- 5177 Anderson Rd
- 8635 Cambridge Loop
- 4634 Sunburst Dr
- 4809 Twilight Place
- 4791 Twilight Place
- 4810 Seafair Dr
- 4802 Seafair Dr
- 4816 Seafair Dr
- 4806 Twilight Place
- 4800 Twilight Place
- 4812 Twilight Place
- 4785 Twilight Place
- 4820 Seafair Dr
- 4792 Seafair Dr
- 4818 Twilight Place
- 4824 Twilight Place
- 4779 Twilight Place
- 8461 Glendale Dr
- 4811 Seafair Dr
- 4833 Twilight Place
- 8471 Mayfair Place
- 4830 Twilight Place
- 4830 Seafair Dr