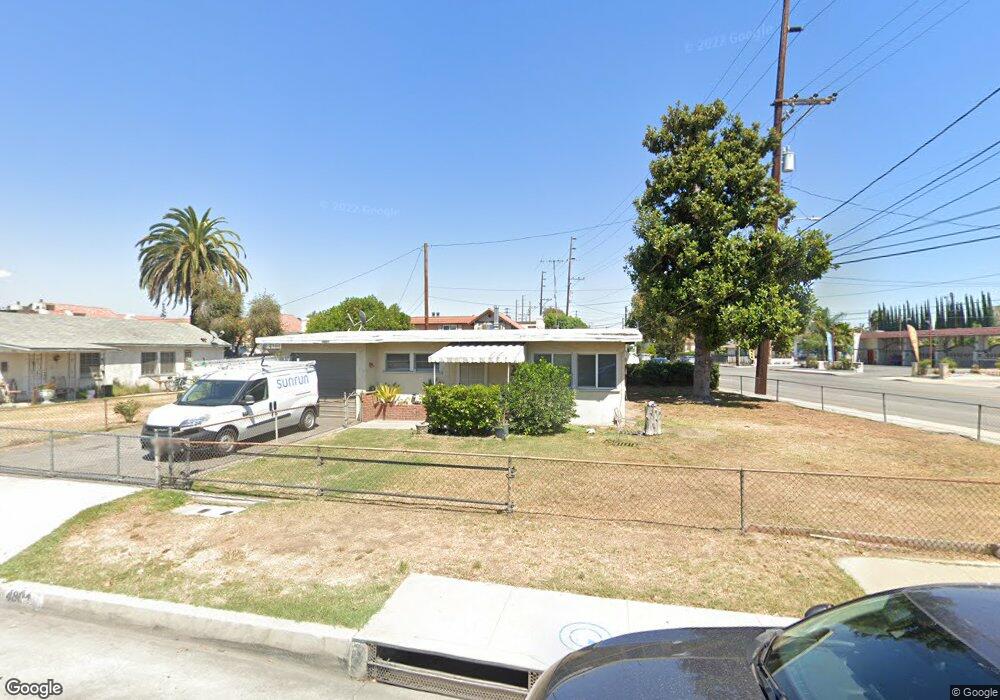
4804 Elrovia Ave El Monte, CA 91732
Norwood Cherrylee NeighborhoodEstimated Value: $918,000 - $1,096,000
4
Beds
3
Baths
1,964
Sq Ft
$511/Sq Ft
Est. Value
About This Home
This home is located at 4804 Elrovia Ave, El Monte, CA 91732 and is currently estimated at $1,004,131, approximately $511 per square foot. 4804 Elrovia Ave is a home located in Los Angeles County with nearby schools including Rio Hondo School, Arroyo High School, and Shield of Faith Christian School.
Ownership History
Date
Name
Owned For
Owner Type
Purchase Details
Closed on
Mar 1, 2011
Sold by
Fung Stacy N T Luu
Bought by
Fung Chris C
Current Estimated Value
Purchase Details
Closed on
Feb 1, 2011
Sold by
Dela Torre Salvador
Bought by
Fung Chris C
Purchase Details
Closed on
Apr 7, 2006
Sold by
Walters Mary M and The Mary M Walters Revocable T
Bought by
Delatorre Salvador
Home Financials for this Owner
Home Financials are based on the most recent Mortgage that was taken out on this home.
Original Mortgage
$70,000
Interest Rate
6.35%
Mortgage Type
Stand Alone Second
Purchase Details
Closed on
Feb 14, 1995
Sold by
Walters Mary M
Bought by
Walters Mary M and Mary M Walters Revocable Trust
Create a Home Valuation Report for This Property
The Home Valuation Report is an in-depth analysis detailing your home's value as well as a comparison with similar homes in the area
Home Values in the Area
Average Home Value in this Area
Purchase History
| Date | Buyer | Sale Price | Title Company |
|---|---|---|---|
| Fung Chris C | -- | First American Title | |
| Fung Chris C | $396,000 | First American Title | |
| Delatorre Salvador | $700,000 | Security Union Title Ins Co | |
| Delatorre Salvador | -- | Security Union Title Ins Co | |
| Walters Mary M | -- | -- |
Source: Public Records
Mortgage History
| Date | Status | Borrower | Loan Amount |
|---|---|---|---|
| Previous Owner | Delatorre Salvador | $70,000 | |
| Previous Owner | Delatorre Salvador | $560,000 |
Source: Public Records
Tax History Compared to Growth
Tax History
| Year | Tax Paid | Tax Assessment Tax Assessment Total Assessment is a certain percentage of the fair market value that is determined by local assessors to be the total taxable value of land and additions on the property. | Land | Improvement |
|---|---|---|---|---|
| 2025 | $7,220 | $507,332 | $403,563 | $103,769 |
| 2024 | $7,220 | $497,385 | $395,650 | $101,735 |
| 2023 | $7,080 | $487,634 | $387,893 | $99,741 |
| 2022 | $6,822 | $478,074 | $380,288 | $97,786 |
| 2021 | $6,907 | $468,701 | $372,832 | $95,869 |
| 2020 | $6,887 | $463,896 | $369,010 | $94,886 |
| 2019 | $7,043 | $454,801 | $361,775 | $93,026 |
| 2018 | $6,862 | $445,884 | $354,682 | $91,202 |
| 2016 | $6,805 | $428,571 | $340,910 | $87,661 |
| 2015 | $6,507 | $422,135 | $335,790 | $86,345 |
| 2014 | $6,261 | $413,867 | $329,213 | $84,654 |
Source: Public Records
Map
Nearby Homes
- 11530 Hallwood Dr
- 4849 Peck Rd Unit 36
- 4849 Peck Rd Unit 67
- 4849 Peck Rd Unit 48
- 11654 Roseglen St
- 11639 Hallwood Dr
- 11328 Elmcrest St
- 11215 Mulhall St
- 4501 Peck Rd Unit 43
- 11211 Mcgirk Ave
- 11396 Mcgirk Ave
- 5320 Peck Rd Unit 49
- 5343 Peck Rd Unit D
- 11946 Fairview St
- 4346 Cypress Ave
- 11414 Lambert Ave
- 5082 La Madera Ave
- 11452 Lambert Ave
- 11212 Freer Ave
- 5220 Myrtus Ave
- 11511 Lower Azusa Rd
- 4813 Elrovia Ave
- 11445 Lower Azusa Rd
- 4819 Elrovia Ave
- 4825 Elrovia Ave
- 11504 Lower Azusa Rd
- 4829 Elrovia Ave
- 4830 Elrovia Ave Unit C
- 4830 Elrovia Ave Unit B
- 4830 Elrovia Ave Unit A
- 4838 Elrovia Ave Unit D
- 4838 Elrovia Ave Unit C
- 4838 Elrovia Ave Unit B
- 4838 Elrovia Ave Unit A
- 11506 Lower Azusa Rd
- 4822 Elrovia Ave Unit A
- 4822 Elrovia Ave
- 4826 Elrovia Ave
- 4834 Elrovia Ave Unit B
- 4834 Elrovia Ave Unit OA