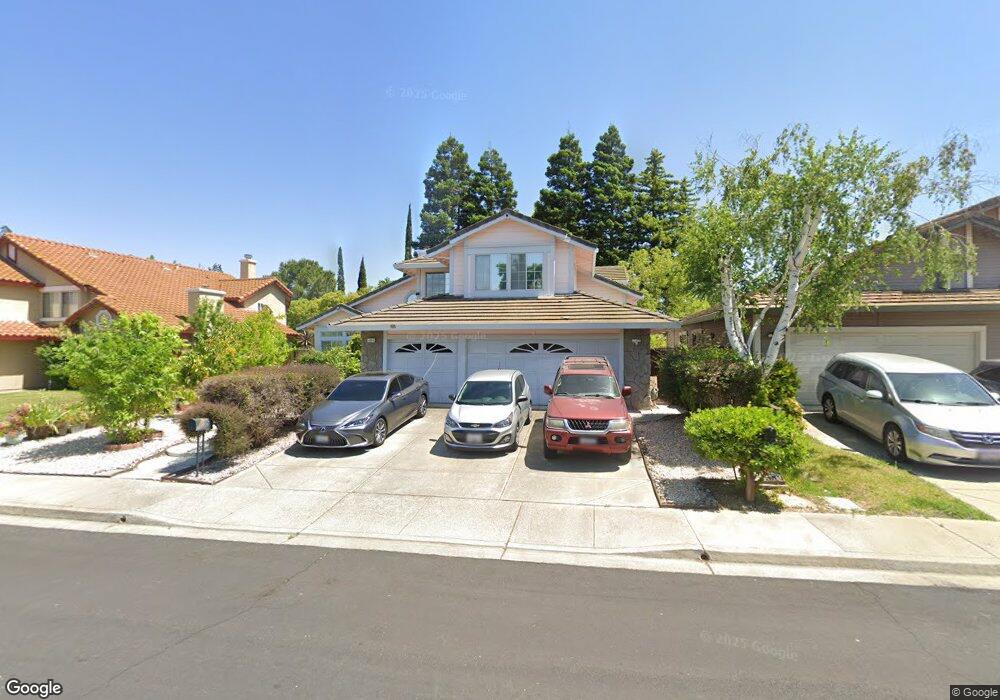
4804 Massive Peak Way Antioch, CA 94531
Lone Tree Valley NeighborhoodEstimated Value: $641,000 - $729,000
4
Beds
3
Baths
2,879
Sq Ft
$242/Sq Ft
Est. Value
About This Home
This home is located at 4804 Massive Peak Way, Antioch, CA 94531 and is currently estimated at $695,441, approximately $241 per square foot. 4804 Massive Peak Way is a home located in Contra Costa County with nearby schools including John Muir Elementary School, Dallas Ranch Middle School, and Deer Valley High School.
Ownership History
Date
Name
Owned For
Owner Type
Purchase Details
Closed on
Apr 19, 2007
Sold by
Bradford Hilda Rossina
Bought by
Bradford Robert J and Bradford Hilda Rossina
Current Estimated Value
Purchase Details
Closed on
Sep 12, 2006
Sold by
Bradford Robert J
Bought by
Bradford Hilda Rossina
Home Financials for this Owner
Home Financials are based on the most recent Mortgage that was taken out on this home.
Original Mortgage
$370,000
Outstanding Balance
$212,175
Interest Rate
1%
Mortgage Type
Negative Amortization
Estimated Equity
$483,266
Purchase Details
Closed on
Dec 26, 1997
Sold by
Saifan Osama I
Bought by
Bradford Robert J and Bradford Hilda Rossina
Home Financials for this Owner
Home Financials are based on the most recent Mortgage that was taken out on this home.
Original Mortgage
$184,720
Interest Rate
8.5%
Mortgage Type
Purchase Money Mortgage
Create a Home Valuation Report for This Property
The Home Valuation Report is an in-depth analysis detailing your home's value as well as a comparison with similar homes in the area
Home Values in the Area
Average Home Value in this Area
Purchase History
| Date | Buyer | Sale Price | Title Company |
|---|---|---|---|
| Bradford Robert J | -- | Liberty Title Company | |
| Bradford Hilda Rossina | -- | Liberty Title Company | |
| Bradford Robert J | $231,000 | -- |
Source: Public Records
Mortgage History
| Date | Status | Borrower | Loan Amount |
|---|---|---|---|
| Open | Bradford Hilda Rossina | $370,000 | |
| Closed | Bradford Robert J | $184,720 | |
| Closed | Bradford Robert J | $34,600 |
Source: Public Records
Tax History
| Year | Tax Paid | Tax Assessment Tax Assessment Total Assessment is a certain percentage of the fair market value that is determined by local assessors to be the total taxable value of land and additions on the property. | Land | Improvement |
|---|---|---|---|---|
| 2025 | $4,756 | $397,420 | $80,782 | $316,638 |
| 2024 | $4,470 | $389,629 | $79,199 | $310,430 |
| 2023 | $4,470 | $381,991 | $77,647 | $304,344 |
| 2022 | $4,402 | $374,502 | $76,125 | $298,377 |
| 2021 | $4,268 | $367,160 | $74,633 | $292,527 |
| 2019 | $4,169 | $356,271 | $72,420 | $283,851 |
| 2018 | $4,009 | $349,286 | $71,000 | $278,286 |
| 2017 | $3,924 | $342,438 | $69,608 | $272,830 |
| 2016 | $3,827 | $335,725 | $68,244 | $267,481 |
| 2015 | $4,127 | $330,683 | $67,219 | $263,464 |
| 2014 | $4,852 | $324,207 | $65,903 | $258,304 |
Source: Public Records
Map
Nearby Homes
- 4737 Crestone Peak Ct
- 4729 Matterhorn Ct
- 4125 Rogers Canyon Rd
- 1505 Barkley Mountain Way
- 1157 Rockspring Way
- 3508 Alberti Ct
- 5004 Star Mine Way
- 4101 S Royal Links Cir
- 4109 S Royal Links Cir
- 2096 Goldpine Way
- 2133 Bamboo Way
- 1879 Mount Conness Way
- 4153 S Royal Links Cir
- 4528 Fallow Way
- 224 Cobblestone Dr
- 5106 Watkings Way
- 4508 Muledeer Ct
- 1821 Kern Mountain Way
- 5081 Mesa Ridge Dr
- 2117 Mark Twain Dr
- 4800 Massive Peak Way
- 4808 Massive Peak Way
- 4805 Belford Peak Way
- 4809 Belford Peak Way
- 4812 Massive Peak Way
- 4801 Belford Peak Way
- 4815 Cache Peak Dr
- 4805 Massive Peak Way
- 4813 Belford Peak Way
- 4809 Massive Peak Way
- 4816 Massive Peak Way
- 4817 Belford Peak Way
- 4813 Massive Peak Way
- 4824 Cache Peak Dr
- 4828 Cache Peak Dr
- 4820 Cache Peak Dr
- 4765 Belford Peak Ct
- 4816 Cache Peak Dr
- 4820 Massive Peak Way
- 4821 Belford Peak Way
Your Personal Tour Guide
Ask me questions while you tour the home.