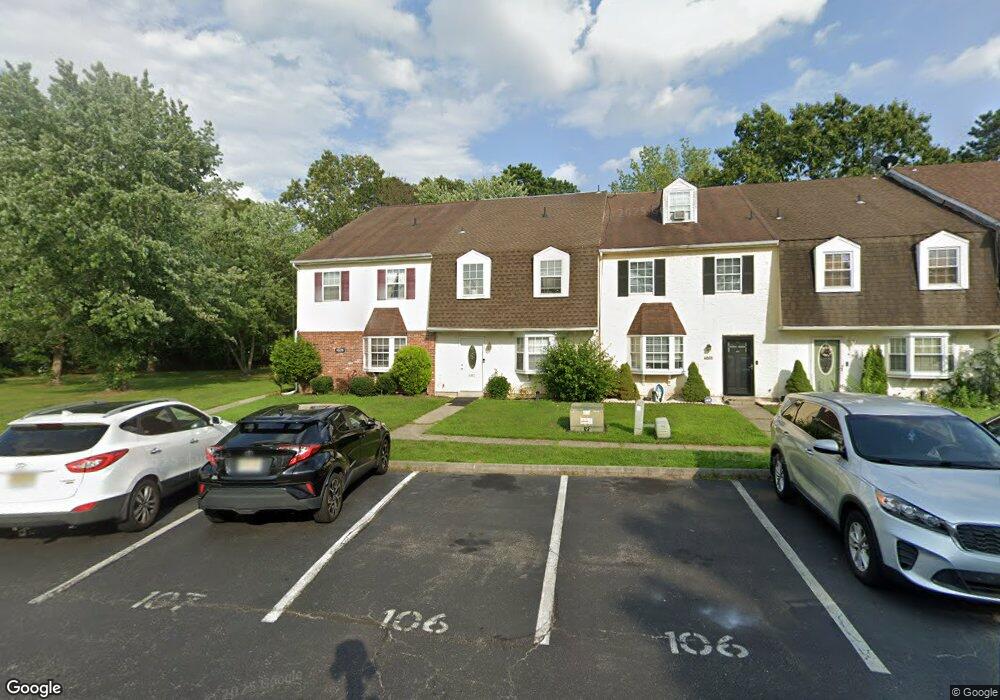
4805 Anglesey Ct Mays Landing, NJ 08330
Estimated Value: $216,000 - $270,092
--
Bed
--
Bath
1,828
Sq Ft
$133/Sq Ft
Est. Value
About This Home
This home is located at 4805 Anglesey Ct, Mays Landing, NJ 08330 and is currently estimated at $243,523, approximately $133 per square foot. 4805 Anglesey Ct is a home located in Atlantic County with nearby schools including George L. Hess Educational Complex, Joseph Shaner School, and William Davies Middle School.
Ownership History
Date
Name
Owned For
Owner Type
Purchase Details
Closed on
Feb 2, 2018
Sold by
Guy Jensyl
Bought by
Florez Vanessa Ruiz and Llufire Jennifer
Current Estimated Value
Home Financials for this Owner
Home Financials are based on the most recent Mortgage that was taken out on this home.
Original Mortgage
$94,118
Outstanding Balance
$80,706
Interest Rate
4.5%
Mortgage Type
FHA
Estimated Equity
$162,817
Purchase Details
Closed on
Oct 3, 2017
Sold by
Pittman Carlinm and Pittman Helen D
Bought by
Guy Jensul
Purchase Details
Closed on
Dec 23, 1999
Sold by
Mif Realty Lp
Bought by
Pittman Helen D and Pittman Carlin
Home Financials for this Owner
Home Financials are based on the most recent Mortgage that was taken out on this home.
Original Mortgage
$73,159
Interest Rate
7.98%
Mortgage Type
FHA
Create a Home Valuation Report for This Property
The Home Valuation Report is an in-depth analysis detailing your home's value as well as a comparison with similar homes in the area
Home Values in the Area
Average Home Value in this Area
Purchase History
| Date | Buyer | Sale Price | Title Company |
|---|---|---|---|
| Florez Vanessa Ruiz | $95,900 | None Available | |
| Guy Jensul | $39,000 | None Available | |
| Pittman Helen D | $79,500 | Commonwealth Land Title Ins |
Source: Public Records
Mortgage History
| Date | Status | Borrower | Loan Amount |
|---|---|---|---|
| Open | Florez Vanessa Ruiz | $94,118 | |
| Previous Owner | Pittman Helen D | $73,159 |
Source: Public Records
Tax History Compared to Growth
Tax History
| Year | Tax Paid | Tax Assessment Tax Assessment Total Assessment is a certain percentage of the fair market value that is determined by local assessors to be the total taxable value of land and additions on the property. | Land | Improvement |
|---|---|---|---|---|
| 2025 | $3,084 | $105,900 | $35,000 | $70,900 |
| 2024 | $3,084 | $89,900 | $35,000 | $54,900 |
| 2023 | $2,900 | $89,900 | $35,000 | $54,900 |
| 2022 | $2,900 | $89,900 | $35,000 | $54,900 |
| 2021 | $2,572 | $79,900 | $25,000 | $54,900 |
| 2020 | $2,572 | $79,900 | $25,000 | $54,900 |
| 2019 | $2,256 | $69,900 | $15,000 | $54,900 |
| 2018 | $2,177 | $69,900 | $15,000 | $54,900 |
| 2017 | $2,005 | $65,400 | $10,500 | $54,900 |
| 2016 | $1,829 | $61,400 | $6,500 | $54,900 |
| 2015 | $1,767 | $61,400 | $6,500 | $54,900 |
| 2014 | $1,902 | $72,400 | $7,500 | $64,900 |
Source: Public Records
Map
Nearby Homes
- 4869 Bala Ct
- 4873 Bala Ct
- 4944 Flintshire Ct
- 4930 Denbigh Ct
- 4922 Denbigh Ct
- 5022 Laydon Ct
- 3 Woodmere Ave
- 14 Strathmere Rd
- 4830 Green Ash Ln Unit 287
- 2614 Dogwood Ct Unit 2614
- 4772 Summersweet Dr
- 0 E Black Horse Unit 22520085
- 4915 Winterbury Dr Unit B14
- 4945 Rosebay Place Unit B17
- 4934 Winterbury Dr Unit I86
- 4944 Rosebay Place
- 2418 Primrose Ct
- 2501 Oleander Ct Unit 3412
- 2340 Primrose Ct
- 2818 Hawthorn Ct Unit 2818
- 4807 Anglesey Ct
- 4803 Anglesey Ct
- 4809 Anglesey Ct
- 4801 Anglesey Ct
- 4811 Anglesey Ct
- 4813 Anglesey Ct
- 4817 Anglesey Ct
- 4819 Anglesey Ct
- 4821 Anglesey Ct
- 4823 Anglesey Ct
- 4825 Anglesey Ct
- 4814 Brecknock Ct
- 4827 Anglesey Ct
- 4812 Brecknock Ct
- 4810 Brecknock Ct
- 4816 Brecknock Ct
- 4829 Anglesey Ct
- 4808 Brecknock Ct
- 4833 Anglesey Ct
- 4806 Brecknock Ct