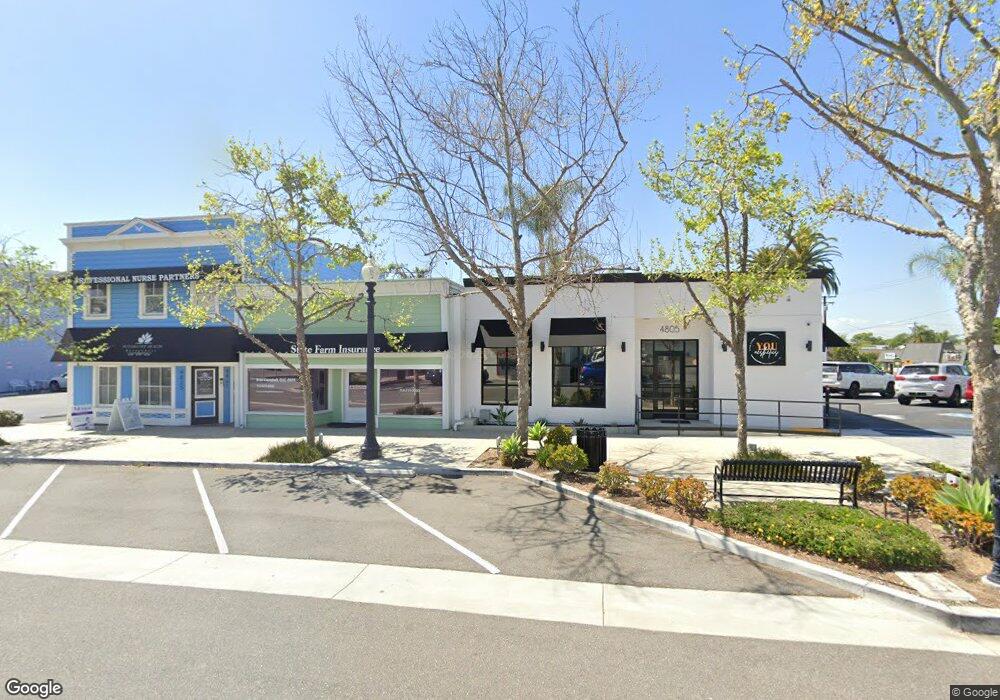
4805 Main St Yorba Linda, CA 92886
Estimated Value: $1,954,473
--
Bed
--
Bath
1,414
Sq Ft
$1,382/Sq Ft
Est. Value
About This Home
This home is located at 4805 Main St, Yorba Linda, CA 92886 and is currently estimated at $1,954,473, approximately $1,382 per square foot. 4805 Main St is a home located in Orange County with nearby schools including Mabel M. Paine Elementary, Yorba Linda Middle School, and Yorba Linda High School.
Ownership History
Date
Name
Owned For
Owner Type
Purchase Details
Closed on
Sep 25, 2020
Sold by
Delgado Victor
Bought by
You Aesthetics Corporation
Current Estimated Value
Home Financials for this Owner
Home Financials are based on the most recent Mortgage that was taken out on this home.
Original Mortgage
$1,115,000
Interest Rate
2.7%
Mortgage Type
New Conventional
Purchase Details
Closed on
Feb 13, 2003
Sold by
Ross Bill and Ross Beverly
Bought by
Delgado Victor
Home Financials for this Owner
Home Financials are based on the most recent Mortgage that was taken out on this home.
Original Mortgage
$423,000
Interest Rate
5.93%
Mortgage Type
Seller Take Back
Purchase Details
Closed on
Oct 1, 1999
Sold by
Ross and Davis
Bought by
Ross Bill and Ross Beverly
Purchase Details
Closed on
Sep 30, 1999
Sold by
Ross Bill and Ross Beverly
Bought by
Ross Bill and Ross Beverly
Create a Home Valuation Report for This Property
The Home Valuation Report is an in-depth analysis detailing your home's value as well as a comparison with similar homes in the area
Home Values in the Area
Average Home Value in this Area
Purchase History
| Date | Buyer | Sale Price | Title Company |
|---|---|---|---|
| You Aesthetics Corporation | $1,350,000 | None Listed On Document | |
| Delgado Victor | $470,000 | Southland Title Corporation | |
| Ross Bill | -- | -- | |
| Ross Bill | -- | -- |
Source: Public Records
Mortgage History
| Date | Status | Borrower | Loan Amount |
|---|---|---|---|
| Open | You Aesthetics Corporation | $1,115,000 | |
| Previous Owner | You Aesthetics Corporation | $1,115,000 | |
| Previous Owner | Delgado Victor | $423,000 |
Source: Public Records
Tax History Compared to Growth
Tax History
| Year | Tax Paid | Tax Assessment Tax Assessment Total Assessment is a certain percentage of the fair market value that is determined by local assessors to be the total taxable value of land and additions on the property. | Land | Improvement |
|---|---|---|---|---|
| 2025 | $20,000 | $1,822,680 | $1,363,864 | $458,816 |
| 2024 | $20,000 | $1,786,942 | $1,337,122 | $449,820 |
| 2023 | $16,245 | $1,508,904 | $1,310,904 | $198,000 |
| 2022 | $15,253 | $1,377,000 | $1,285,200 | $91,800 |
| 2021 | $7,204 | $628,869 | $307,750 | $321,119 |
| 2020 | $7,224 | $622,421 | $304,594 | $317,827 |
| 2019 | $6,968 | $610,217 | $298,621 | $311,596 |
| 2018 | $6,884 | $598,252 | $292,765 | $305,487 |
| 2017 | $6,773 | $586,522 | $287,024 | $299,498 |
| 2016 | $6,637 | $575,022 | $281,396 | $293,626 |
| 2015 | $6,558 | $566,385 | $277,169 | $289,216 |
| 2014 | $6,364 | $555,291 | $271,740 | $283,551 |
Source: Public Records
Map
Nearby Homes
- 4760 Lakeview Ave
- 4788 Lakeview Ave Unit 48
- 18302 Piper Place
- 18083 Burke Ln
- 4845 Eisenhower Ct
- 18044 Burke Ln
- 4891 Eureka Ave Unit 25
- 5152 Lakeview Ave
- 4951 Oak Tree Ct
- 18534 Cobblestone Ct
- 4317 Canyon Coral Ln
- 17781 Lerene Dr
- 4712 Yorba Ln
- 5231 Highland Ave
- 5141 Siesta Ln
- 4302 Eureka Ave
- 18568 Arbor Gate Ln
- 18141 Bastanchury Rd
- 18640 Seabiscuit Run
- 18665 Seabiscuit Run