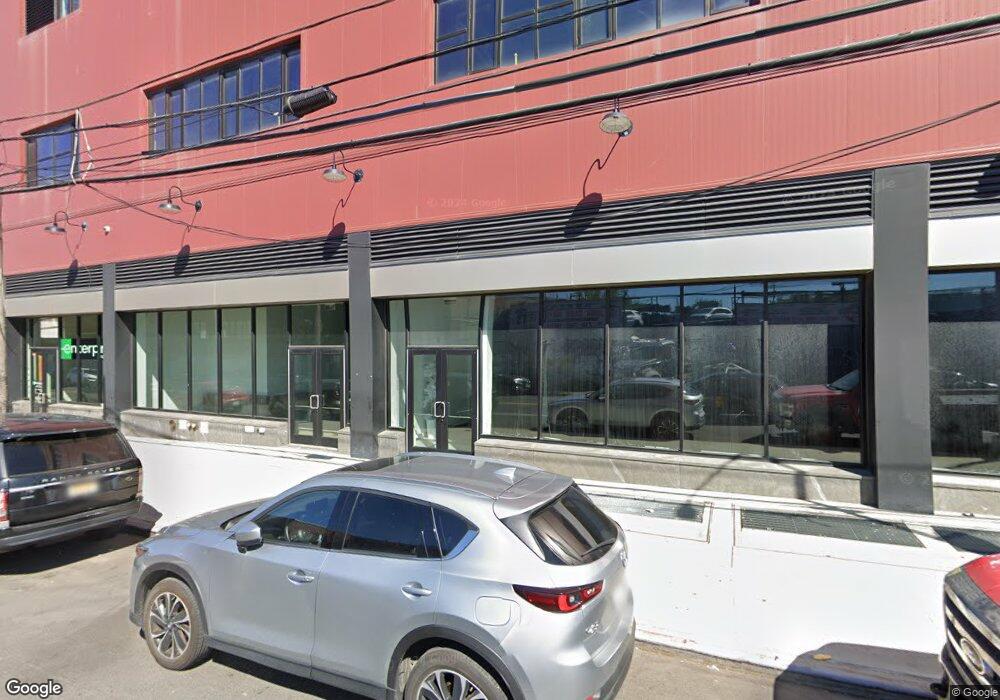
4805 Metropolitan Ave Unit 2 Flushing, NY 11385
Maspeth NeighborhoodEstimated Value: $43,808,712
--
Bed
--
Bath
126,235
Sq Ft
$347/Sq Ft
Est. Value
About This Home
This home is located at 4805 Metropolitan Ave Unit 2, Flushing, NY 11385 and is currently estimated at $43,808,712, approximately $347 per square foot. 4805 Metropolitan Ave Unit 2 is a home located in Queens County with nearby schools including I.S. 093 Ridgewood, Grover Cleveland High School, and Notre Dame Catholic Academy.
Ownership History
Date
Name
Owned For
Owner Type
Purchase Details
Closed on
Dec 1, 2022
Sold by
Sp Hhf Sub B Llc
Bought by
Sp Hhf Sub Ridgewood Llc
Current Estimated Value
Home Financials for this Owner
Home Financials are based on the most recent Mortgage that was taken out on this home.
Original Mortgage
$10,182,428
Outstanding Balance
$9,884,089
Interest Rate
7.08%
Mortgage Type
Purchase Money Mortgage
Estimated Equity
$33,924,623
Purchase Details
Closed on
Dec 20, 2012
Sold by
Acadia Storage Post Portfolio Company Ll
Bought by
Sp Hhf Sub B Llc
Purchase Details
Closed on
May 20, 2011
Sold by
Acadia Storage Post Metropolitan Avenue
Bought by
Acadia Storage Post Portfolio Company Ll
Purchase Details
Closed on
Jan 10, 2006
Sold by
4805 Metropolitan Realty Llc and Metropolitan 48Th Holdings Llc
Bought by
American Storage Properties North Llc
Purchase Details
Closed on
Jan 6, 2005
Sold by
4805 Metropolitan Realty Llc
Bought by
Metropolitan 48Th Holding Llc
Purchase Details
Closed on
Nov 19, 2002
Sold by
Metpro Associates
Bought by
48-05 Metropolitan Realt
Create a Home Valuation Report for This Property
The Home Valuation Report is an in-depth analysis detailing your home's value as well as a comparison with similar homes in the area
Home Values in the Area
Average Home Value in this Area
Purchase History
| Date | Buyer | Sale Price | Title Company |
|---|---|---|---|
| Sp Hhf Sub Ridgewood Llc | -- | -- | |
| Sp Hhf Sub B Llc | $23,912,133 | -- | |
| Sp Hhf Sub B Llc | $23,912,133 | -- | |
| Acadia Storage Post Portfolio Company Ll | -- | -- | |
| Acadia Storage Post Portfolio Company Ll | -- | -- | |
| American Storage Properties North Llc | $5,300,000 | -- | |
| American Storage Properties North Llc | $5,300,000 | -- | |
| Metropolitan 48Th Holding Llc | -- | -- | |
| Metropolitan 48Th Holding Llc | -- | -- | |
| 48-05 Metropolitan Realt | -- | -- | |
| 48-05 Metropolitan Realt | -- | -- |
Source: Public Records
Mortgage History
| Date | Status | Borrower | Loan Amount |
|---|---|---|---|
| Open | Sp Hhf Sub Ridgewood Llc | $10,182,428 |
Source: Public Records
Tax History Compared to Growth
Tax History
| Year | Tax Paid | Tax Assessment Tax Assessment Total Assessment is a certain percentage of the fair market value that is determined by local assessors to be the total taxable value of land and additions on the property. | Land | Improvement |
|---|---|---|---|---|
| 2025 | $66,730 | $6,248,430 | $630,000 | $5,618,430 |
| 2024 | $66,730 | $6,234,210 | $630,000 | $5,604,210 |
| 2023 | $66,730 | $6,203,430 | $630,000 | $5,573,430 |
| 2022 | $67,757 | $6,231,600 | $630,000 | $5,601,600 |
| 2021 | $67,372 | $5,183,550 | $630,000 | $4,553,550 |
| 2020 | $116,170 | $6,774,750 | $630,000 | $6,144,750 |
| 2019 | $115,917 | $6,503,400 | $630,000 | $5,873,400 |
| 2018 | $115,916 | $5,244,679 | $630,000 | $4,614,679 |
| 2017 | $115,916 | $4,440,032 | $630,000 | $3,810,032 |
| 2016 | $116,578 | $4,440,032 | $630,000 | $3,810,032 |
| 2015 | $10,979 | $3,000,484 | $630,000 | $2,370,484 |
| 2014 | $10,979 | $2,549,225 | $630,000 | $1,919,225 |
Source: Public Records
Map
Nearby Homes
- 1980 Starr St Unit 3F
- 21 Charlotte St
- 18-60 Flushing Ave Unit Townhouse
- 18-60 Flushing Ave
- 60-30 53rd St
- 60-17 54th St
- 209 Onderdonk Ave
- 5431 Nurge Ave
- 1801 Starr St
- 60-41 55th St
- 60-89 54th St
- 5368 Metropolitan Ave
- 6089 54th St
- 21-17 Rene Ct
- 1861 Dekalb Ave
- 2128 Rene Ct
- 6077 55th St
- 17-12 Starr St
- 60-85 55th St
- 17-07 Suydam St
- 4805 Metropolitan Ave
- 4805 Metropolitan Ave Unit 1
- 4929 Metropolitan Ave
- 4929 Metropolitan Ave
- 4801 Metropolitan Ave
- 4801 Metropolitan Ave
- 4825 Metropolitan Ave
- 50-01 Metropolitan Ave Unit 2
- 50-01 Metropolitan Ave Unit 201
- 50-01 Metropolitan Ave Unit 306
- 50-01 Metropolitan Ave Unit 2nd Floor
- 50-03 Metropolitan Ave Unit Suite A
- 4906 Metropolitan Ave
- 4901 Metropolitan Ave
- 5005 Metropolitan Ave
- 5005 Metropolitan Ave Unit 1st+Ll
- 5005 Metropolitan Ave Unit 3rd+Ph
- 5005 Metropolitan Ave
- 5005 Metropolitan Ave Unit 2nd Fl
- 5005 Metropolitan Ave Unit 2Fl-3F