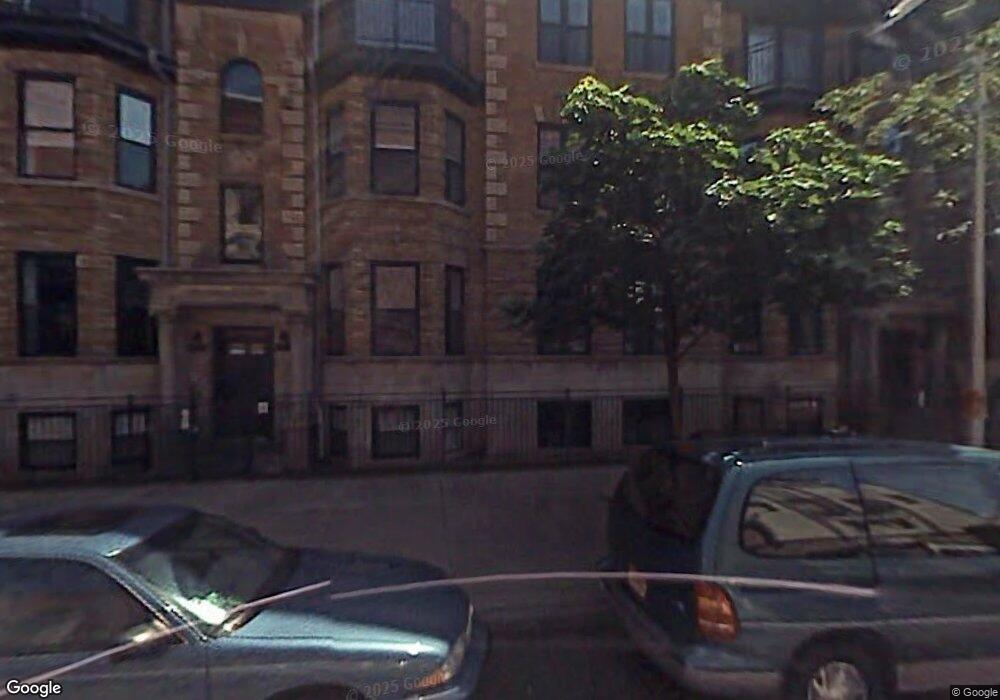
4805 N Winthrop Ave Unit 48051 Chicago, IL 60640
Sheridan Park NeighborhoodEstimated Value: $382,000 - $438,000
2
Beds
2
Baths
1,350
Sq Ft
$310/Sq Ft
Est. Value
About This Home
This home is located at 4805 N Winthrop Ave Unit 48051, Chicago, IL 60640 and is currently estimated at $418,916, approximately $310 per square foot. 4805 N Winthrop Ave Unit 48051 is a home located in Cook County with nearby schools including Mccutcheon Elementary School, Senn High School, and St Thomas Of Canterbury School.
Ownership History
Date
Name
Owned For
Owner Type
Purchase Details
Closed on
Jan 20, 2021
Sold by
Takach Chad M and Williams Elizabeth Cabell
Bought by
Marlow Stephen and Gorniak Rayme Jon
Current Estimated Value
Home Financials for this Owner
Home Financials are based on the most recent Mortgage that was taken out on this home.
Original Mortgage
$207,500
Outstanding Balance
$189,868
Interest Rate
2.49%
Mortgage Type
New Conventional
Estimated Equity
$229,048
Purchase Details
Closed on
Dec 10, 2012
Sold by
Takach Chad M and Williams Elizabeth Cabell
Bought by
Takach Chad M and Williams Elizabeth Cabell
Home Financials for this Owner
Home Financials are based on the most recent Mortgage that was taken out on this home.
Original Mortgage
$247,937
Interest Rate
3.43%
Mortgage Type
New Conventional
Purchase Details
Closed on
Jun 1, 2007
Sold by
New Horizons Development Group Iii Llc
Bought by
Takach Chad M and Williams Elizabeth Cabell
Home Financials for this Owner
Home Financials are based on the most recent Mortgage that was taken out on this home.
Original Mortgage
$248,800
Interest Rate
6.2%
Mortgage Type
Purchase Money Mortgage
Create a Home Valuation Report for This Property
The Home Valuation Report is an in-depth analysis detailing your home's value as well as a comparison with similar homes in the area
Home Values in the Area
Average Home Value in this Area
Purchase History
| Date | Buyer | Sale Price | Title Company |
|---|---|---|---|
| Marlow Stephen | $307,500 | Stewart Title Guaranty Co | |
| Takach Chad M | -- | None Available | |
| Takach Chad M | $311,000 | Cti |
Source: Public Records
Mortgage History
| Date | Status | Borrower | Loan Amount |
|---|---|---|---|
| Open | Marlow Stephen | $207,500 | |
| Previous Owner | Takach Chad M | $247,937 | |
| Previous Owner | Takach Chad M | $248,800 |
Source: Public Records
Tax History Compared to Growth
Tax History
| Year | Tax Paid | Tax Assessment Tax Assessment Total Assessment is a certain percentage of the fair market value that is determined by local assessors to be the total taxable value of land and additions on the property. | Land | Improvement |
|---|---|---|---|---|
| 2024 | $5,613 | $33,881 | $4,211 | $29,670 |
| 2023 | $6,177 | $29,000 | $3,391 | $25,609 |
| 2022 | $6,177 | $29,000 | $3,391 | $25,609 |
| 2021 | $5,353 | $28,999 | $3,391 | $25,608 |
| 2020 | $3,203 | $16,983 | $2,599 | $14,384 |
| 2019 | $3,220 | $18,899 | $2,599 | $16,300 |
| 2018 | $3,164 | $18,899 | $2,599 | $16,300 |
| 2017 | $3,350 | $18,421 | $2,260 | $16,161 |
| 2016 | $3,292 | $18,421 | $2,260 | $16,161 |
| 2015 | $2,994 | $18,421 | $2,260 | $16,161 |
| 2014 | $2,976 | $18,133 | $1,723 | $16,410 |
| 2013 | $2,923 | $18,133 | $1,723 | $16,410 |
Source: Public Records
Map
Nearby Homes
- 4826 N Winthrop Ave Unit 2S
- 4832 N Winthrop Ave
- 4834 N Kenmore Ave Unit 3N
- 4879 N Winthrop Ave Unit D
- 1215 W Gunnison St Unit 205
- 4715 N Racine Ave Unit 305
- 4848 N Sheridan Rd Unit 710
- 1000 W Leland Ave Unit 12G
- 1015 W Ainslie St Unit 2
- 4911 N Kenmore Ave Unit 1S
- 4933 N Winthrop Ave Unit 2S
- 4634 N Racine Ave Unit 3
- 4936 N Winthrop Ave Unit 1E
- 4641 N Magnolia Ave Unit 3S
- 4932 N Sheridan Rd
- 4652 N Magnolia Ave
- 4755 N Malden St Unit GS
- 905 W Lakeside Place Unit 2F
- 1057 W Argyle St Unit 3
- 4731 N Malden St Unit 3S
- 4805 N Winthrop Ave Unit 5
- 4805 N Winthrop Ave Unit 48055
- 4805 N Winthrop Ave Unit 48053
- 4805 N Winthrop Ave Unit 1
- 4801 N Winthrop Ave Unit 3
- 4801 N Winthrop Ave Unit 48011
- 4801 N Winthrop Ave Unit 48015
- 4801 N Winthrop Ave Unit 48013
- 4801 N Winthrop Ave Unit 5
- 4801 N Winthrop Ave Unit 1
- 4803 N Winthrop Ave Unit 48032
- 4803 N Winthrop Ave Unit 48036
- 4803 N Winthrop Ave Unit 48034
- 4803 N Winthrop Ave Unit 4
- 4803 N Winthrop Ave Unit 2
- 4803 N Winthrop Ave Unit 6
- 4807 N Winthrop Ave Unit 4
- 4807 N Winthrop Ave Unit 48076
- 4807 N Winthrop Ave Unit 48072
- 4807 N Winthrop Ave Unit 48074