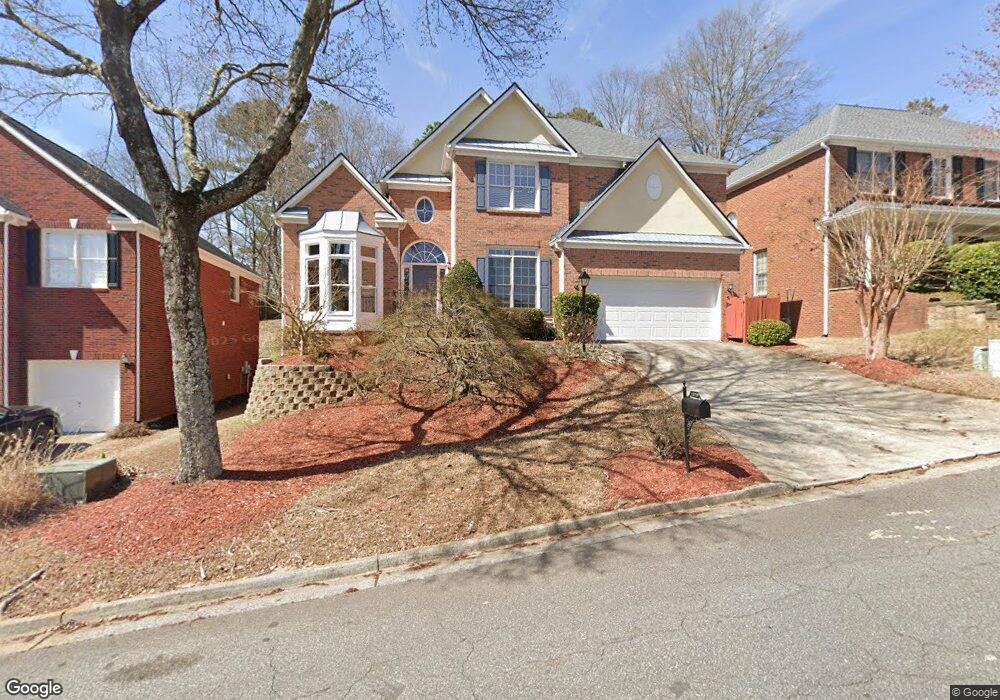
4806 Clay Brooke Dr SE Smyrna, GA 30082
Estimated Value: $593,280 - $684,000
4
Beds
3
Baths
2,805
Sq Ft
$226/Sq Ft
Est. Value
About This Home
This home is located at 4806 Clay Brooke Dr SE, Smyrna, GA 30082 and is currently estimated at $634,070, approximately $226 per square foot. 4806 Clay Brooke Dr SE is a home located in Cobb County with nearby schools including Nickajack Elementary School, Campbell Middle School, and Campbell High School.
Ownership History
Date
Name
Owned For
Owner Type
Purchase Details
Closed on
Aug 30, 2000
Sold by
Pulte Home Corp
Bought by
Vail Hugh B and Vail Beverlee G
Current Estimated Value
Home Financials for this Owner
Home Financials are based on the most recent Mortgage that was taken out on this home.
Original Mortgage
$213,350
Outstanding Balance
$154,773
Interest Rate
8.11%
Mortgage Type
New Conventional
Estimated Equity
$479,297
Purchase Details
Closed on
Mar 2, 1999
Sold by
Ryland Group Inc
Bought by
Edmonson Kevin D
Home Financials for this Owner
Home Financials are based on the most recent Mortgage that was taken out on this home.
Original Mortgage
$210,600
Interest Rate
6.74%
Mortgage Type
New Conventional
Create a Home Valuation Report for This Property
The Home Valuation Report is an in-depth analysis detailing your home's value as well as a comparison with similar homes in the area
Home Values in the Area
Average Home Value in this Area
Purchase History
| Date | Buyer | Sale Price | Title Company |
|---|---|---|---|
| Vail Hugh B | $266,800 | -- | |
| Edmonson Kevin D | $263,300 | -- |
Source: Public Records
Mortgage History
| Date | Status | Borrower | Loan Amount |
|---|---|---|---|
| Open | Vail Hugh B | $213,350 | |
| Previous Owner | Edmonson Kevin D | $210,600 |
Source: Public Records
Tax History Compared to Growth
Tax History
| Year | Tax Paid | Tax Assessment Tax Assessment Total Assessment is a certain percentage of the fair market value that is determined by local assessors to be the total taxable value of land and additions on the property. | Land | Improvement |
|---|---|---|---|---|
| 2025 | $808 | $231,740 | $40,000 | $191,740 |
| 2024 | $808 | $231,740 | $40,000 | $191,740 |
| 2023 | $656 | $231,740 | $40,000 | $191,740 |
| 2022 | $4,052 | $181,656 | $40,000 | $141,656 |
| 2021 | $3,860 | $170,300 | $40,000 | $130,300 |
| 2020 | $3,860 | $170,300 | $40,000 | $130,300 |
| 2019 | $3,465 | $149,544 | $40,800 | $108,744 |
| 2018 | $3,465 | $149,544 | $40,800 | $108,744 |
| 2017 | $3,166 | $142,352 | $36,000 | $106,352 |
| 2016 | $3,170 | $142,352 | $36,000 | $106,352 |
| 2015 | $2,907 | $125,328 | $32,000 | $93,328 |
| 2014 | $2,820 | $119,508 | $0 | $0 |
Source: Public Records
Map
Nearby Homes
- 4781 Highside Way SE
- 1652 Wehunt Place SE Unit 26
- 1706 Durley Down Ct SE
- 1631 Wehunt Place SE Unit 14
- 308 Holbrook Rd Unit 11
- 4901 Prince Rd SE
- 4931 Durley Ln SE
- 5188 Laurel Bridge Ct SE
- 0 Gaylor St Unit 10203409
- 0 Gaylor St Unit 7275195
- 5013 Duxford Dr SE Unit 1
- 5162 Laurel Bridge Ct SE
- 5066 Healey Dr
- 1292 Creekside Terrace SE
- 1286 Creekside Terrace SE
- 5033 David Place SE
- 0 Highlands Pkwy SE Unit 11594650
- 1266 Creekside Terrace SE
- 5055 Crowe Dr SE
- 1554 Cooper Lake Rd SE
- 4808 Clay Brooke Dr SE
- 4804 Clay Brooke Dr SE Unit 1
- 4810 Clay Brooke Dr SE
- 4802 Clay Brooke Dr SE Unit 1
- 4801 Dixon Lake Dr SE
- 4731 Camp Highland Rd SE
- 1624 Omara Ln SE
- 4741 Camp Highland Rd SE
- 4811 Clay Brooke Dr SE
- 4800 Clay Brooke Dr SE
- 4812 Clay Brooke Dr SE
- 4805 Clay Brooke Dr SE
- 4813 Clay Brooke Dr SE
- 1626 Omara Ln SE
- 4751 Camp Highland Rd SE
- 4751 Camp Highland Rd SE Unit B
- 4803 Clay Brooke Dr SE Unit 199
- 4803 Clay Brooke Dr SE
- 4814 Clay Brooke Dr SE Unit 8
- 4814 Clay Brooke Dr SE