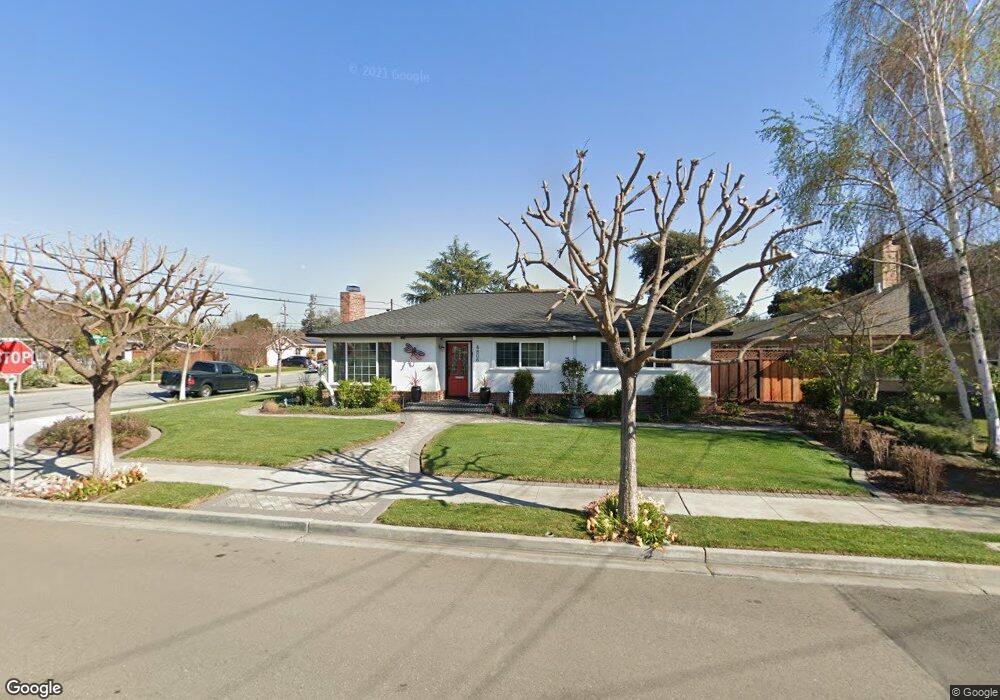
4806 Mayfield Dr Fremont, CA 94536
Glenmoor NeighborhoodEstimated Value: $1,464,000 - $1,776,000
3
Beds
2
Baths
1,323
Sq Ft
$1,194/Sq Ft
Est. Value
About This Home
This home is located at 4806 Mayfield Dr, Fremont, CA 94536 and is currently estimated at $1,579,902, approximately $1,194 per square foot. 4806 Mayfield Dr is a home located in Alameda County with nearby schools including Glenmoor Elementary School, Centerville Junior High School, and Washington High School.
Ownership History
Date
Name
Owned For
Owner Type
Purchase Details
Closed on
Mar 29, 2005
Sold by
March Janice L
Bought by
March Janice Lee and March Janice Lee
Current Estimated Value
Purchase Details
Closed on
Sep 20, 2001
Sold by
Hicks Stanley H
Bought by
March Janice L
Home Financials for this Owner
Home Financials are based on the most recent Mortgage that was taken out on this home.
Original Mortgage
$275,000
Outstanding Balance
$103,950
Interest Rate
6.57%
Estimated Equity
$1,475,952
Purchase Details
Closed on
May 29, 1998
Sold by
Lee Terry
Bought by
Hicks Stanley H and March Janice L
Home Financials for this Owner
Home Financials are based on the most recent Mortgage that was taken out on this home.
Original Mortgage
$264,000
Interest Rate
7.1%
Purchase Details
Closed on
Oct 16, 1996
Sold by
Lee Terry
Bought by
Lee Terry and Terry Lee 1996 Trust
Create a Home Valuation Report for This Property
The Home Valuation Report is an in-depth analysis detailing your home's value as well as a comparison with similar homes in the area
Home Values in the Area
Average Home Value in this Area
Purchase History
| Date | Buyer | Sale Price | Title Company |
|---|---|---|---|
| March Janice Lee | -- | -- | |
| March Janice L | -- | First American Title Co | |
| Hicks Stanley H | $330,000 | North American Title Co | |
| Lee Terry | -- | -- |
Source: Public Records
Mortgage History
| Date | Status | Borrower | Loan Amount |
|---|---|---|---|
| Open | March Janice L | $275,000 | |
| Closed | Hicks Stanley H | $264,000 | |
| Closed | Hicks Stanley H | $33,000 | |
| Closed | March Janice L | $160,000 |
Source: Public Records
Tax History Compared to Growth
Tax History
| Year | Tax Paid | Tax Assessment Tax Assessment Total Assessment is a certain percentage of the fair market value that is determined by local assessors to be the total taxable value of land and additions on the property. | Land | Improvement |
|---|---|---|---|---|
| 2025 | $6,594 | $519,900 | $158,070 | $368,830 |
| 2024 | $6,594 | $509,571 | $154,971 | $361,600 |
| 2023 | $6,408 | $506,444 | $151,933 | $354,511 |
| 2022 | $6,312 | $489,514 | $148,954 | $347,560 |
| 2021 | $6,159 | $479,778 | $146,033 | $340,745 |
| 2020 | $6,136 | $481,790 | $144,537 | $337,253 |
| 2019 | $6,067 | $472,344 | $141,703 | $330,641 |
| 2018 | $5,946 | $463,084 | $138,925 | $324,159 |
| 2017 | $5,797 | $454,007 | $136,202 | $317,805 |
| 2016 | $5,691 | $445,107 | $133,532 | $311,575 |
| 2015 | $5,609 | $438,421 | $131,526 | $306,895 |
| 2014 | $5,507 | $429,834 | $128,950 | $300,884 |
Source: Public Records
Map
Nearby Homes
- 4754 Northdale Dr
- 4715 Eggers Dr
- 38324 Blacow Rd
- 4586 Norris Rd
- 37987 Alta Dr
- 4328 Cognina Ct
- 37721 Madera Ct
- 5169 Lawler Ave
- 37792 Colfax Ct
- 4714 Serra Ave
- 37621 Glenmoor Dr
- 4237 Garland Dr
- 38265 Corrigan Ct
- 5033 Blacksand Rd
- 5268 Keeler Ct
- 5516 Higo Way
- 38533 Amaranto St
- 5550 Higo Way
- 5562 Higo Way
- 38532 Cedar Blvd
- 4824 Mayfield Dr
- 38641 Glenview Dr
- 38626 Glenview Dr
- 4823 Northdale Dr
- 4842 Mayfield Dr
- 4797 Northdale Dr
- 4807 Mayfield Dr
- 4825 Mayfield Dr
- 4839 Northdale Dr
- 4772 Mayfield Dr
- 4785 Mayfield Dr
- 4860 Mayfield Dr
- 4843 Mayfield Dr
- 4781 Northdale Dr
- 4855 Northdale Dr
- 4771 Mayfield Dr
- 4861 Mayfield Dr
- 38721 Glenview Dr
- 4810 Eggers Dr
- 4826 Northdale Dr