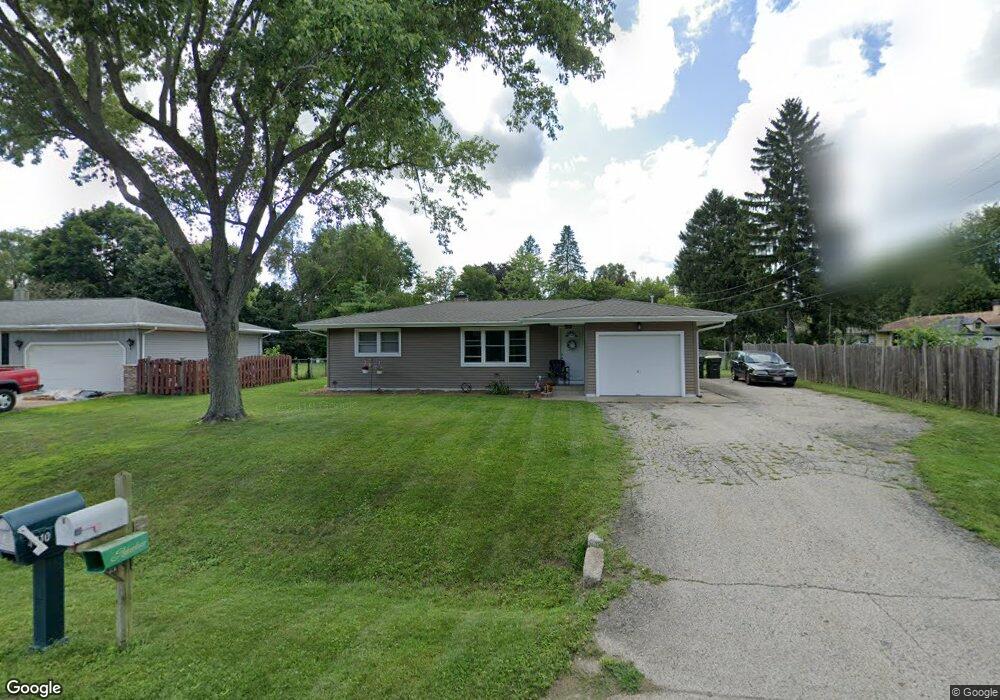
4807 William St Unit 3 McHenry, IL 60051
Pistakee Highlands NeighborhoodEstimated Value: $225,000 - $238,000
2
Beds
1
Bath
904
Sq Ft
$257/Sq Ft
Est. Value
About This Home
This home is located at 4807 William St Unit 3, McHenry, IL 60051 and is currently estimated at $232,187, approximately $256 per square foot. 4807 William St Unit 3 is a home located in McHenry County with nearby schools including Ringwood School Primary Center, Johnsburg Elementary School, and Johnsburg Jr High School.
Ownership History
Date
Name
Owned For
Owner Type
Purchase Details
Closed on
Jul 5, 2022
Sold by
Ramlow Properties Llc
Bought by
Borkland Leila A and Borkland Michael J
Current Estimated Value
Purchase Details
Closed on
Sep 25, 2018
Sold by
Ramlow Richard E and Ramlow Kimberly A
Bought by
Ramlow Properties Llc
Purchase Details
Closed on
Sep 21, 2011
Sold by
Secretary Of Housing & Urban Development
Bought by
Ramlow Richard E and Ramlow Kimberly A
Purchase Details
Closed on
Sep 14, 2010
Sold by
Cooley Thomas J
Bought by
The Secretary Of Housing & Urban Develop
Purchase Details
Closed on
May 30, 2006
Sold by
Amcore Investment Groups Na
Bought by
Cooley Thomas J and Cooley Kimberly K
Home Financials for this Owner
Home Financials are based on the most recent Mortgage that was taken out on this home.
Original Mortgage
$158,450
Interest Rate
6.68%
Mortgage Type
FHA
Create a Home Valuation Report for This Property
The Home Valuation Report is an in-depth analysis detailing your home's value as well as a comparison with similar homes in the area
Home Values in the Area
Average Home Value in this Area
Purchase History
We collect this data history from publicly available records. To have your information removed, we recommend requesting removal directly through your county’s website.
| Date | Buyer | Sale Price | Title Company |
|---|---|---|---|
| Borkland Leila A | $170,000 | None Listed On Document | |
| Ramlow Properties Llc | -- | Attorney | |
| Ramlow Richard E | $42,000 | Stewart Title Company | |
| The Secretary Of Housing & Urban Develop | $153,945 | None Available | |
| Cooley Thomas J | $161,000 | Ticor |
Source: Public Records
Mortgage History
We collect this data history from publicly available records. To have your information removed, we recommend requesting removal directly through your county’s website.
| Date | Status | Borrower | Loan Amount |
|---|---|---|---|
| Previous Owner | Cooley Thomas J | $158,450 |
Source: Public Records
Tax History
| Year | Tax Paid | Tax Assessment Tax Assessment Total Assessment is a certain percentage of the fair market value that is determined by local assessors to be the total taxable value of land and additions on the property. | Land | Improvement |
|---|---|---|---|---|
| 2024 | $3,111 | $54,507 | $6,324 | $48,183 |
| 2023 | $3,184 | $51,192 | $15,768 | $35,424 |
| 2022 | $3,605 | $47,492 | $14,628 | $32,864 |
| 2021 | $3,454 | $44,228 | $13,623 | $30,605 |
| 2020 | $3,359 | $42,384 | $13,055 | $29,329 |
| 2019 | $3,323 | $40,247 | $12,397 | $27,850 |
| 2018 | $3,238 | $38,422 | $11,835 | $26,587 |
| 2017 | $3,165 | $36,060 | $11,107 | $24,953 |
| 2016 | $3,147 | $33,701 | $10,380 | $23,321 |
| 2013 | -- | $30,975 | $10,219 | $20,756 |
Source: Public Records
Map
Nearby Homes
- 5103 Autumn Way
- 1516 W Sudeenew Dr
- 5010 N Westwood Dr
- 4802 Brorson Ln
- 4418 Hickorynut Dr
- 1322 Lakeview St
- 4226 N Riverdale Dr
- 615 W Eastern Ave
- 1001 W Broadway St
- 5207 N Lake St
- 1022 River Terrace Dr
- 4018 Pitzen Rd
- Lot 11 Blk 4 Acorn Ln
- 706 Henry Trail
- Lot 34 & 35 Cedar Creek Dr
- 5709 Fox Lake Rd Unit 2
- 5504 Louella Ave
- 1617 Sunnyside Beach Dr
- 5217 N Pleasant View Dr
- 609 Monterrey Terrace
- 1205 Jasper Dr
- 1203 Jasper Dr
- 4814 Gregory St
- 4815 Gregory St
- 4815 Gregory St
- 4812 Gregory St
- 1201 Jasper Dr
- 1208 Jasper Dr
- 1204 Jasper Dr
- 1210 Jasper Dr
- 4901 Roger St
- 4805 William St
- 4811 Gregory St
- 1215 Jasper Dr
- 4810 Gregory St
- 1212 Jasper Dr
- 4809 Gregory St
- 4803 William St
- 4905 Roger St
- 1114 Jasper Dr Unit 3
Your Personal Tour Guide
Ask me questions while you tour the home.