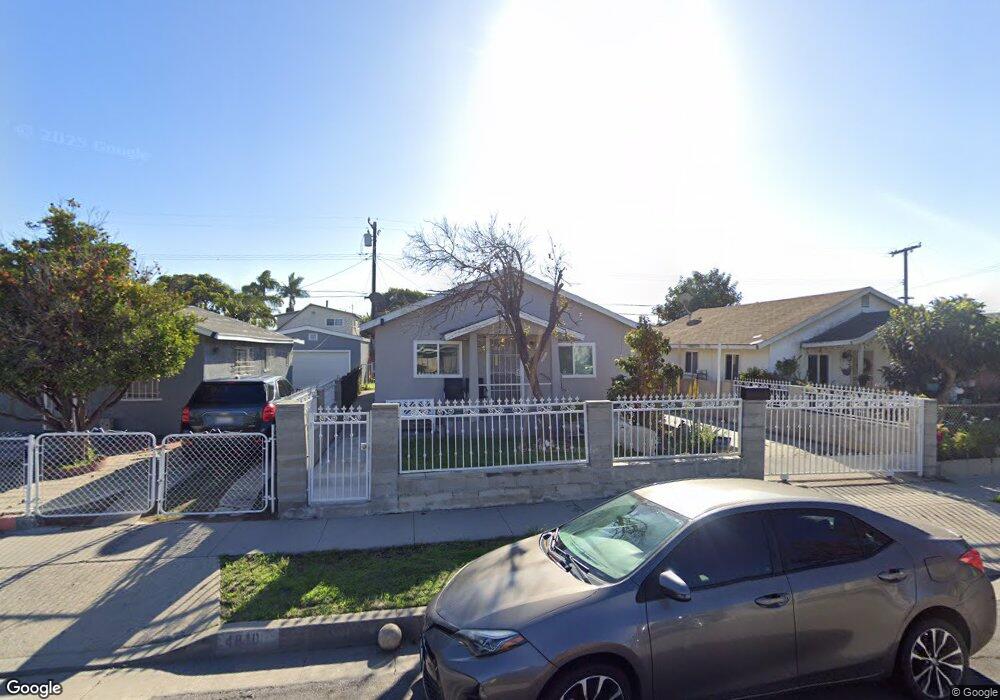
4808 Ivy St Pico Rivera, CA 90660
Estimated Value: $505,000 - $806,000
1
Bed
1
Bath
540
Sq Ft
$1,139/Sq Ft
Est. Value
About This Home
This home is located at 4808 Ivy St, Pico Rivera, CA 90660 and is currently estimated at $615,050, approximately $1,138 per square foot. 4808 Ivy St is a home located in Los Angeles County with nearby schools including Montebello Gardens Elementary School, La Merced Intermediate School, and Montebello High School.
Ownership History
Date
Name
Owned For
Owner Type
Purchase Details
Closed on
Aug 6, 2018
Sold by
Dominguez Adrian Jacob
Bought by
Dominguez Adrian J and Dominguez Erika
Current Estimated Value
Home Financials for this Owner
Home Financials are based on the most recent Mortgage that was taken out on this home.
Original Mortgage
$193,000
Outstanding Balance
$167,613
Interest Rate
4.5%
Mortgage Type
New Conventional
Estimated Equity
$447,437
Purchase Details
Closed on
Nov 25, 2014
Sold by
Martinez Gloria
Bought by
Dominguez Adrian Jacob
Purchase Details
Closed on
Feb 14, 2007
Sold by
Martinez Raymond and Martinez Gloria
Bought by
Martinez Raymond
Purchase Details
Closed on
Nov 11, 2002
Sold by
Garza Alex and Garza Lydia
Bought by
Martinez Raymond
Home Financials for this Owner
Home Financials are based on the most recent Mortgage that was taken out on this home.
Original Mortgage
$168,750
Interest Rate
5.89%
Create a Home Valuation Report for This Property
The Home Valuation Report is an in-depth analysis detailing your home's value as well as a comparison with similar homes in the area
Home Values in the Area
Average Home Value in this Area
Purchase History
| Date | Buyer | Sale Price | Title Company |
|---|---|---|---|
| Dominguez Adrian J | -- | First American Title Company | |
| Dominguez Adrian Jacob | -- | None Available | |
| Martinez Raymond | -- | None Available | |
| Martinez Raymond | $225,000 | United Title Company |
Source: Public Records
Mortgage History
| Date | Status | Borrower | Loan Amount |
|---|---|---|---|
| Open | Dominguez Adrian J | $193,000 | |
| Previous Owner | Martinez Raymond | $168,750 |
Source: Public Records
Tax History Compared to Growth
Tax History
| Year | Tax Paid | Tax Assessment Tax Assessment Total Assessment is a certain percentage of the fair market value that is determined by local assessors to be the total taxable value of land and additions on the property. | Land | Improvement |
|---|---|---|---|---|
| 2025 | $5,623 | $416,734 | $333,388 | $83,346 |
| 2024 | $5,623 | $408,563 | $326,851 | $81,712 |
| 2023 | $5,616 | $400,553 | $320,443 | $80,110 |
| 2022 | $5,412 | $392,700 | $314,160 | $78,540 |
| 2021 | $5,176 | $385,000 | $308,000 | $77,000 |
| 2019 | $4,402 | $323,214 | $269,346 | $53,868 |
| 2018 | $4,384 | $316,877 | $264,065 | $52,812 |
| 2016 | $4,197 | $304,574 | $253,812 | $50,762 |
| 2015 | $3,957 | $300,000 | $250,000 | $50,000 |
| 2014 | $2,788 | $194,935 | $155,951 | $38,984 |
Source: Public Records
Map
Nearby Homes
- 4753 Orange St
- 4724 Orange St
- 4709 Grape St
- 4758 Oak St
- 4653 Pine St
- 272 Maiden Ln
- 424 Bradley Ave
- 8630 Elba St
- 8421 Culp Dr
- 4424 Calada Ave
- 416 W Cleveland Ave
- 4568 Los Toros Ave
- 524 N Poplar Ave
- 425 Valera Dr
- 8509 Beverly Blvd
- 4707 Rosemead Blvd
- 525 N 3rd St
- 701 W Madison Ave
- 4918 Rosemead Blvd
- 5442 Zola Ave